Content
-
Weekly Highlights
- Market Commentary
- Durable Goods
- Risks


The spot market remains on fire, as HRC prices move towards $650/st with little in sight to disrupt the upward momentum in the short term. This week, a mini-mill alerted buyers through an unofficial announcement that their offer price for new HRC inquiries would be $680. This propelled the price even higher, marking the 12th straight week of rising prices with the rally spanning over $200/st and still going. Our analysis indicates that this is the fastest price rally over the past 10 years, with prices increasing over 5% per week on average. Moreover, the longer the rally last, the more upside momentum is possible. As inventories dwindle throughout the supply chain, buyers have few other options to secure material, forcing them to accept higher prices and longer lead times. This week we will look at how the futures market has reacted during this rally, and how it should be used to help defend against further increases.
The chart below shows the four upcoming HRC futures expirations with Nov in white, Dec in blue, Jan in red, and Feb in yellow as of yesterday.
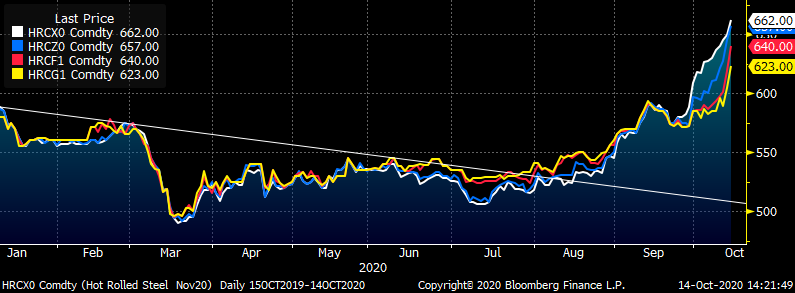
The price trended downward for most of this year, with these expirations following the spot price and trading within a tight range. However, since the July lows, the November expiration has increased by nearly twice the amount of the February expiration, reflecting the tightness in the spot market. This is additional support for the point that in a panicked market, steel today is more valuable than steel tomorrow. If a buyer wants steel in November, they must pay a premium compared to deliveries in February. This is why service centers with inventory on the ground are able to sell at higher prices than mills during times like these.
As mentioned above, inventories will eventually be depleted, which will drive more buyers to the mills, increasing their negotiating power. With domestic production levels still historically low, and very little foreign competition, prices have significant upside risk through the end of the year. Additionally, lead times can remain extended, pushing the risk for buyers of not having material well into the first quarter of 2021. If this is a scenario that you see as likely, or if it is a significant risk to your business, the futures market may be able to alleviate some of this pain. The February future is currently priced at a $39 discount to the November. Locking in that discounted price today can help offset the higher cost should prices continue to rally into next year.
However, turning to the futures market right now will not help resolve current material deficits. In order to protect your business against the dynamics of the current market rally, hedges must be placed well before the panic ensues. This entails developing a long-term, systematic hedging program that will reduce the volatility that distresses so many steel consumers.
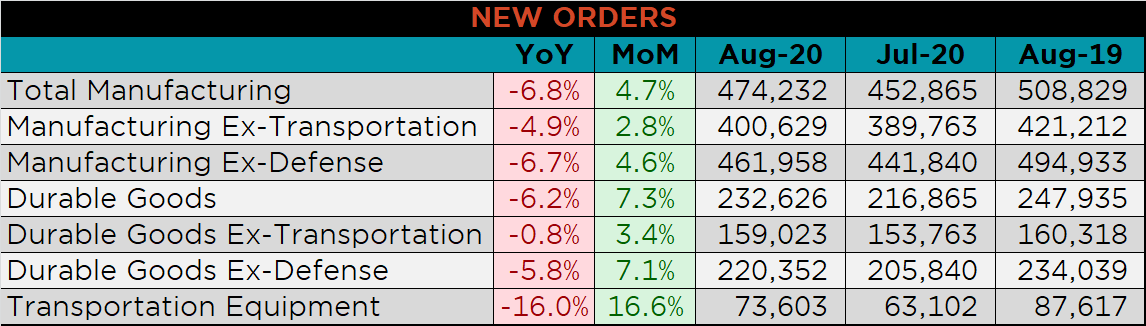
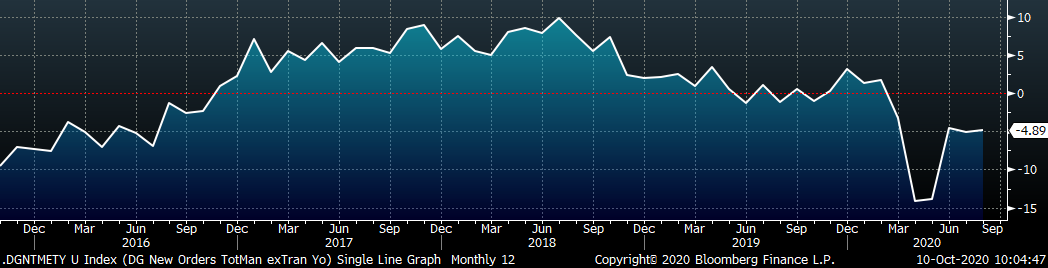
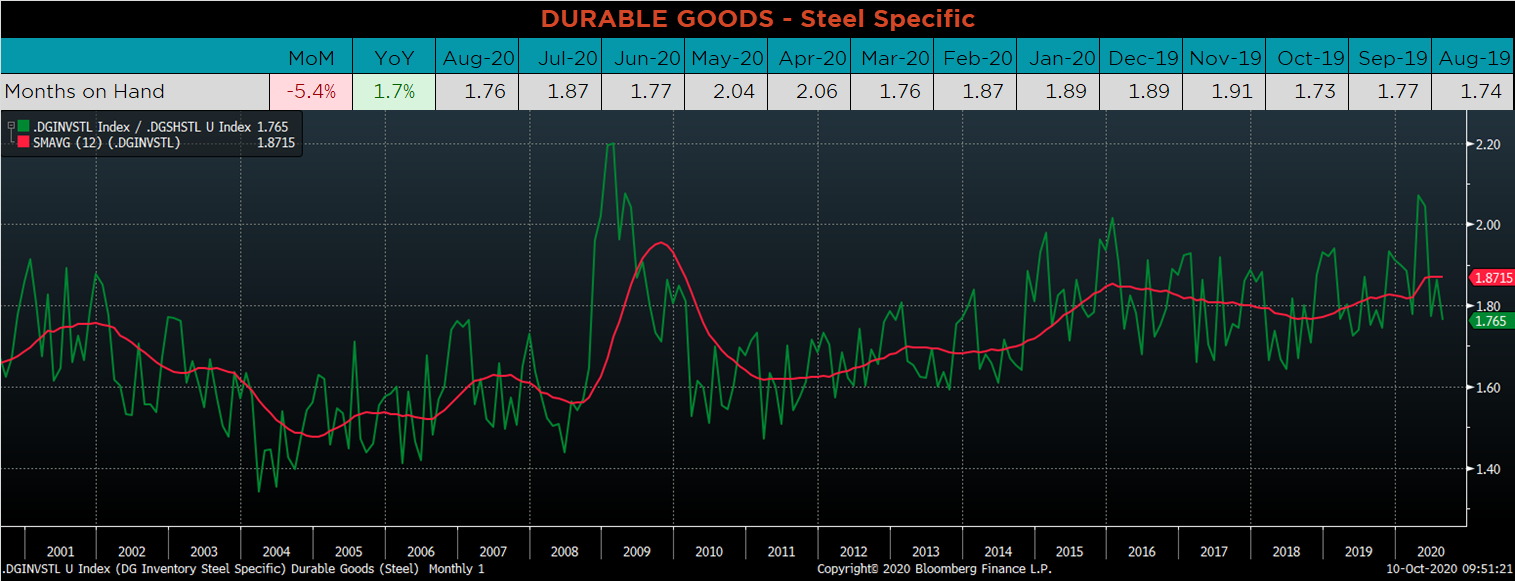
Below are final August new orders from the Durable Goods report. New orders for manufactured goods were down 6.8% compared to August 2019, but up compared to last month. Manufacturing new orders ex-transportation have remained approximately 5% below 2019 levels for the last 3 months. The final chart looks at the months on hand (inventory divided by shipments) for durable goods categories that are steel intensive. MOH were lower, as monthly shipments increased and inventories decreased.
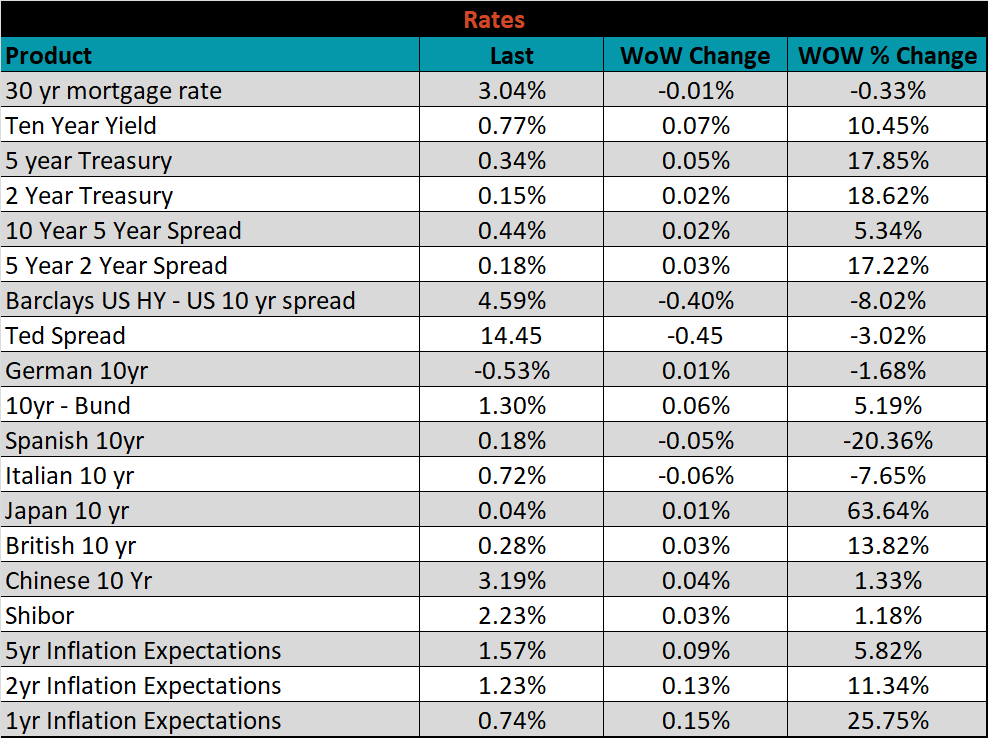
Below are the most pertinent upside and downside price risks:
Upside Risks:
Downside Risks:
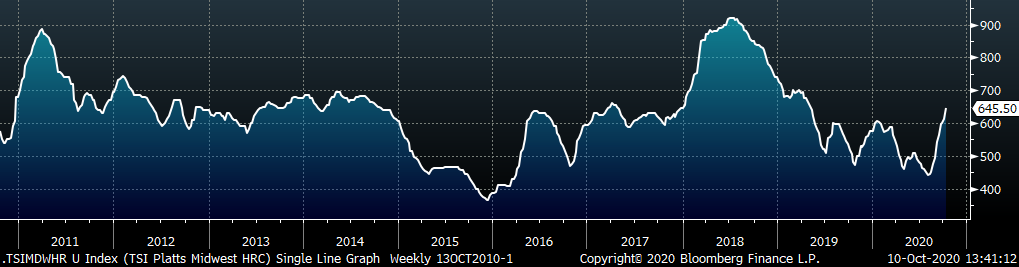
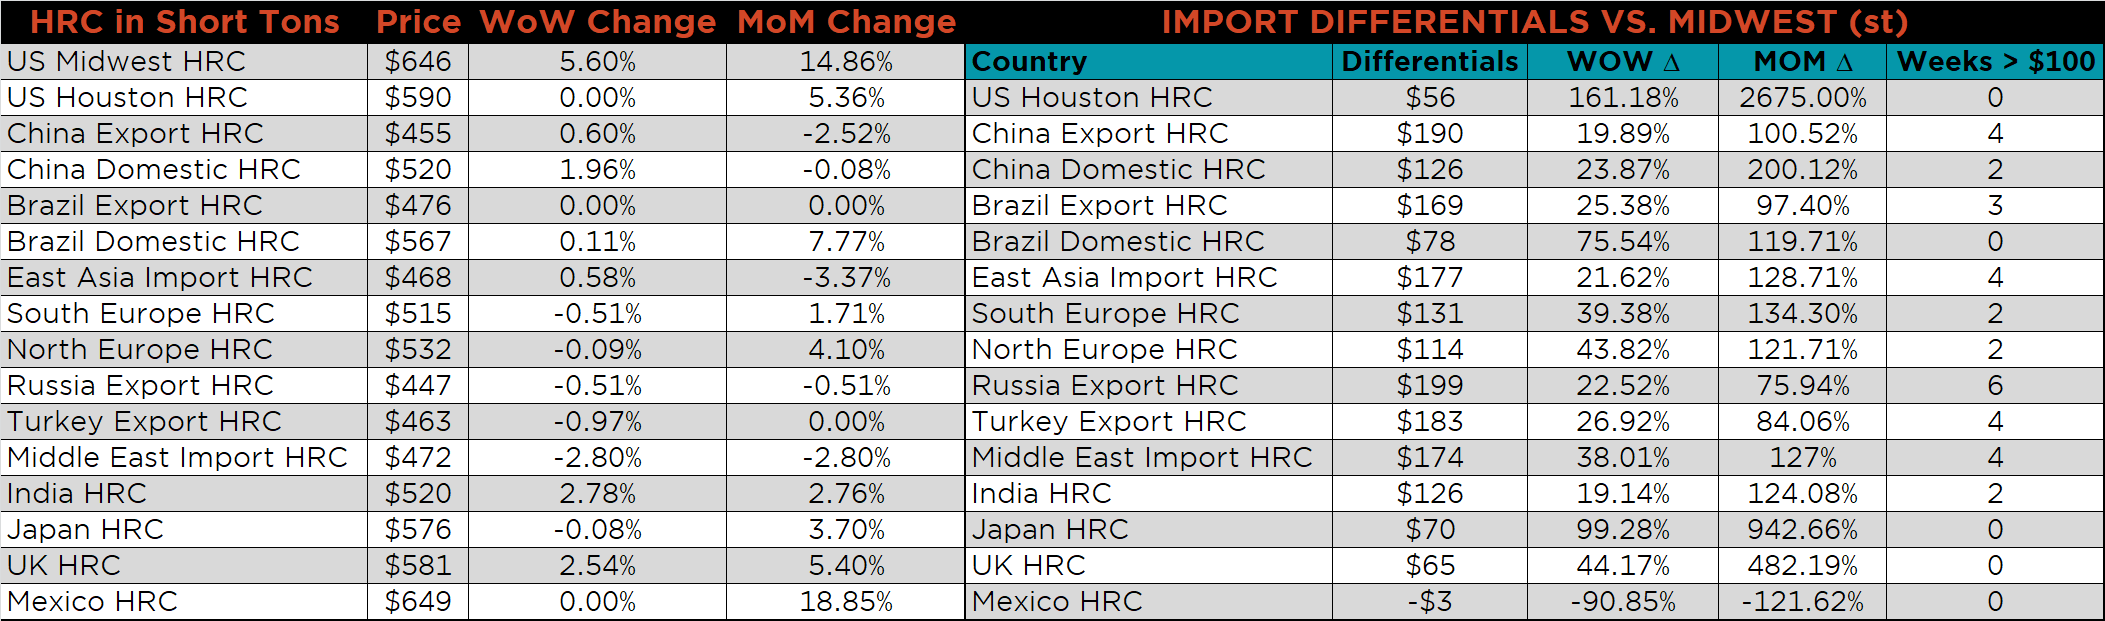
The Platts TSI Daily Midwest HRC Index increased by $34.25 to $645.50.
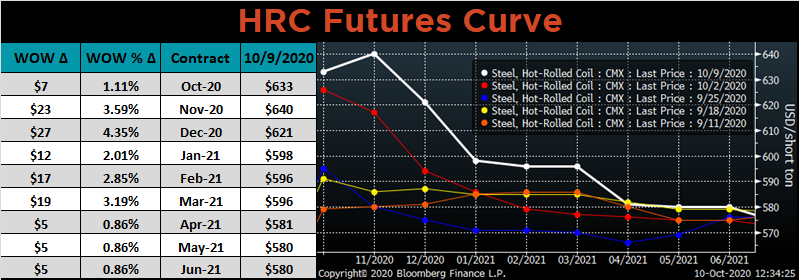
The CME Midwest HRC futures curve is below with last Friday’s settlements in white. The front of the curve rose significantly again last week, while the back of the curve remains range bound.
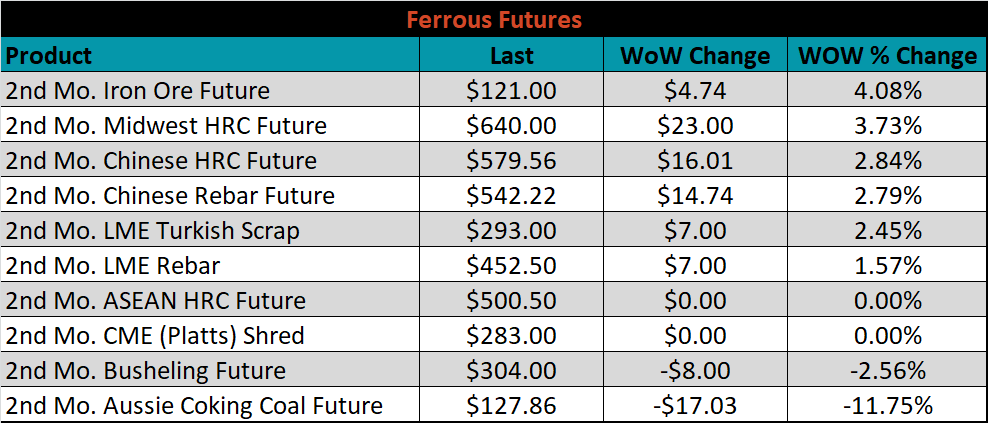
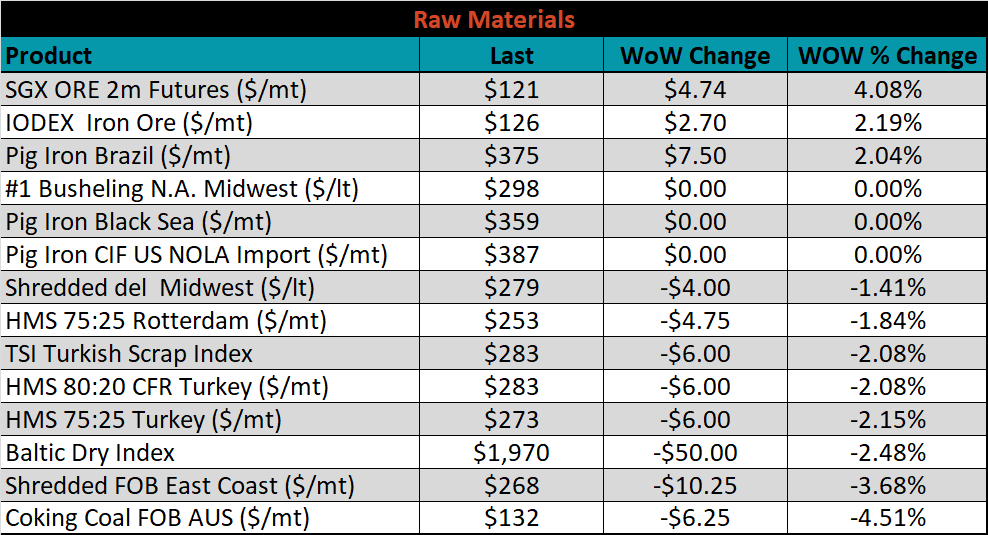
November ferrous futures were mixed. Iron ore gained 4.1%, while Aussie coking coal fell 11.8%.
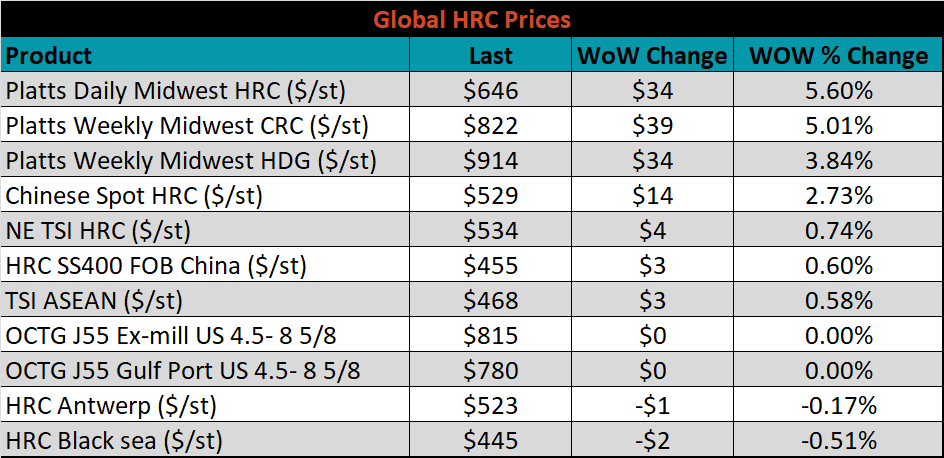
The global flat rolled indexes were mostly higher. TSI Platts Midwest HRC was up 5.6%, while Black Sea HRC was down 0.5%.
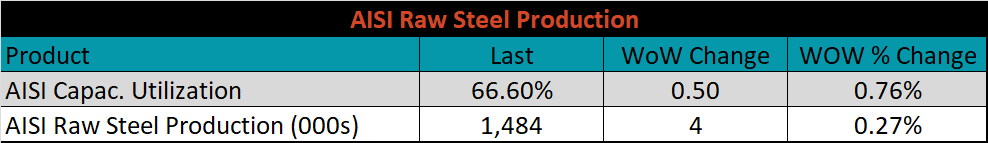
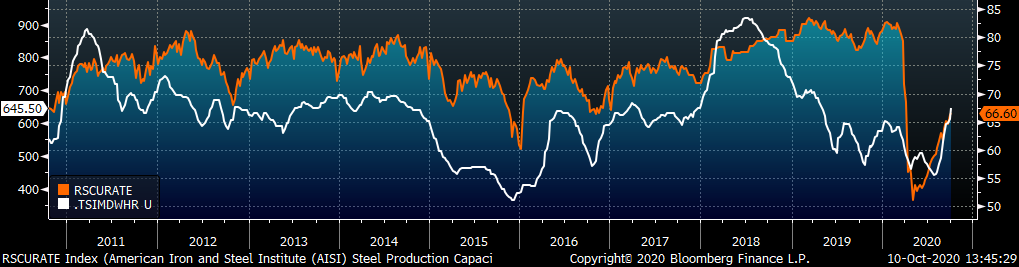
The AISI Capacity Utilization rate increased 0.5% to 66.6%.
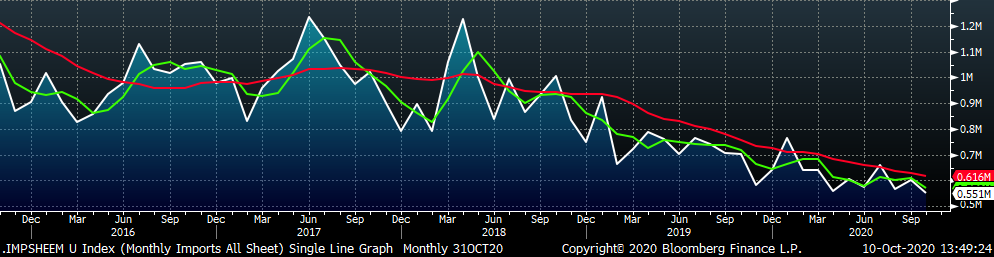
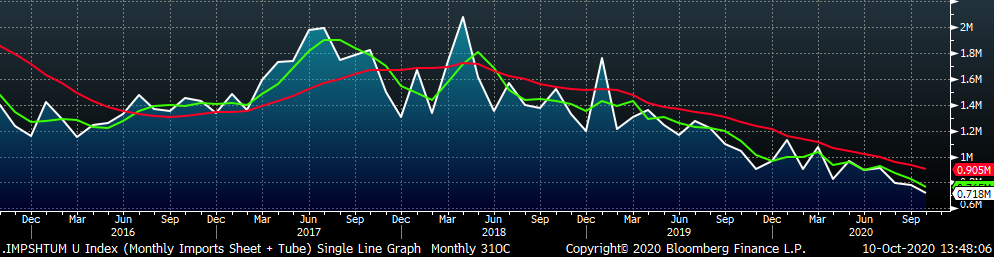
October flat rolled import license data is forecasting a decrease of 50k to 551k MoM.
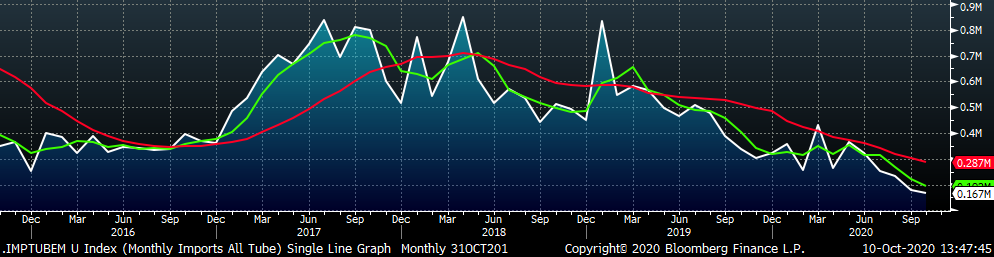
Tube imports license data is forecasting a decrease of 10k to 167k in October.
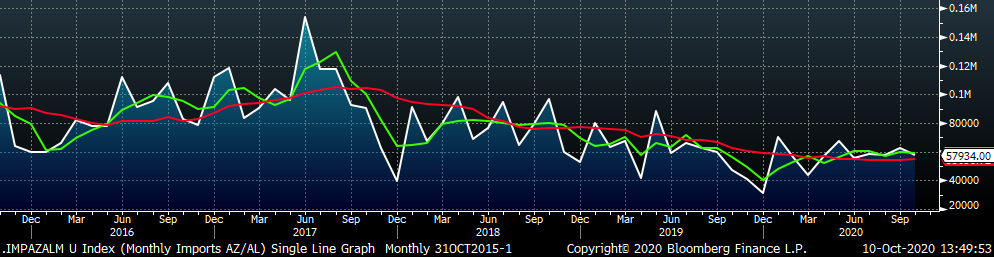
October AZ/AL import license data is forecasting a 5k decrease to 58k.
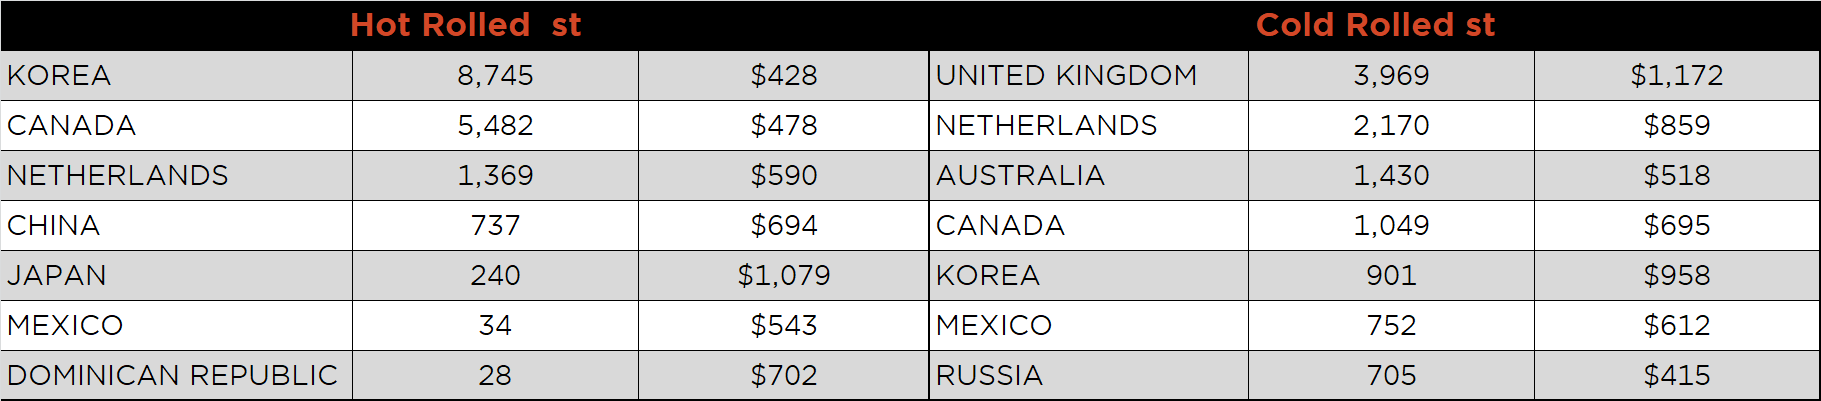
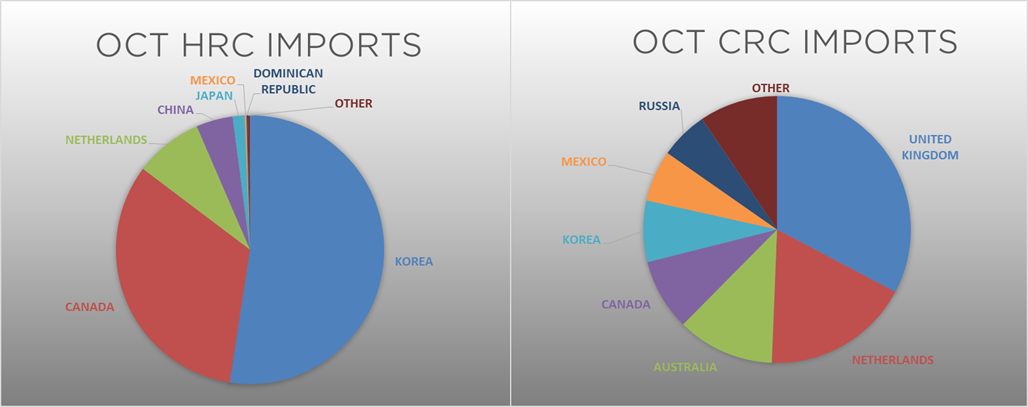
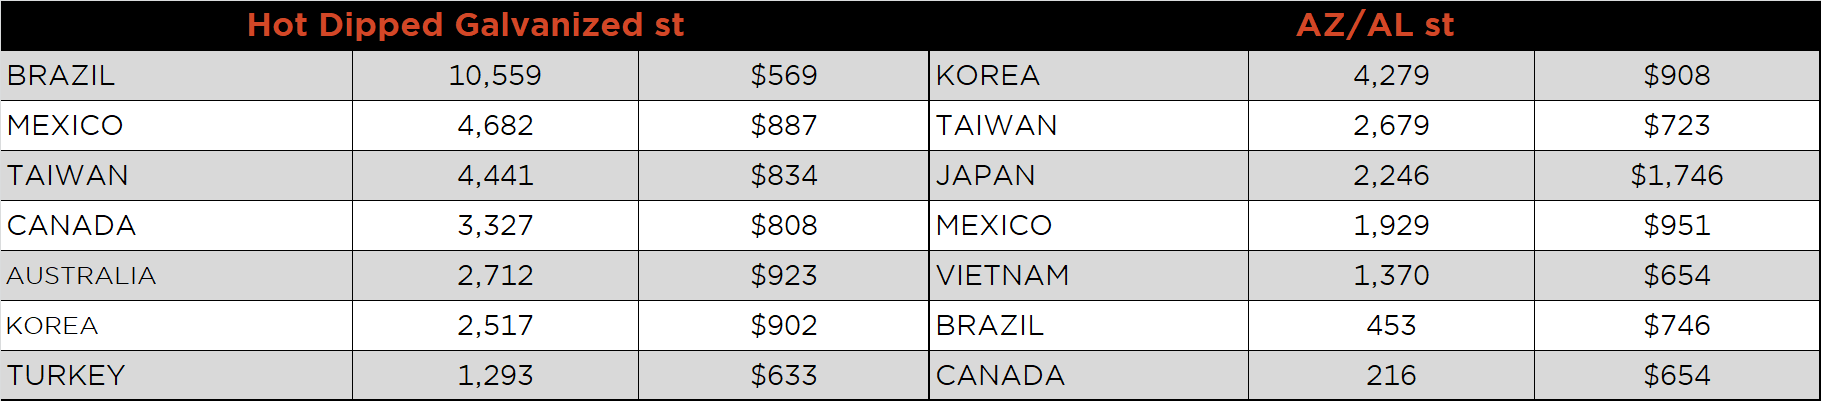
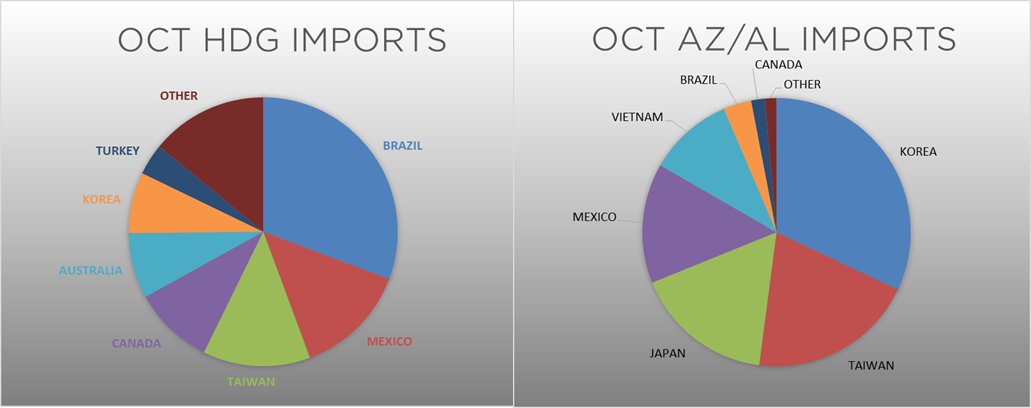
Below is October import license data through October 6, 2020.
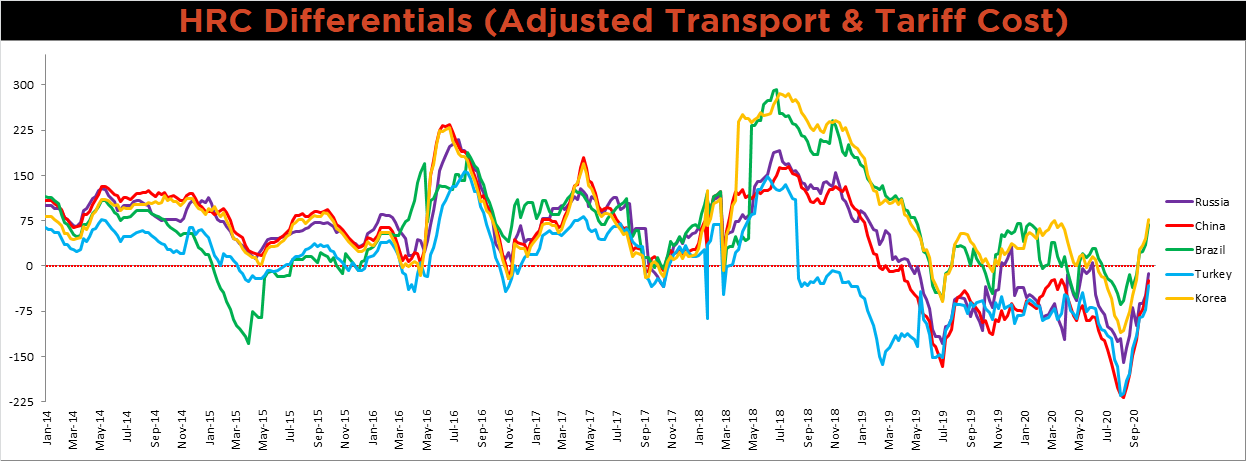
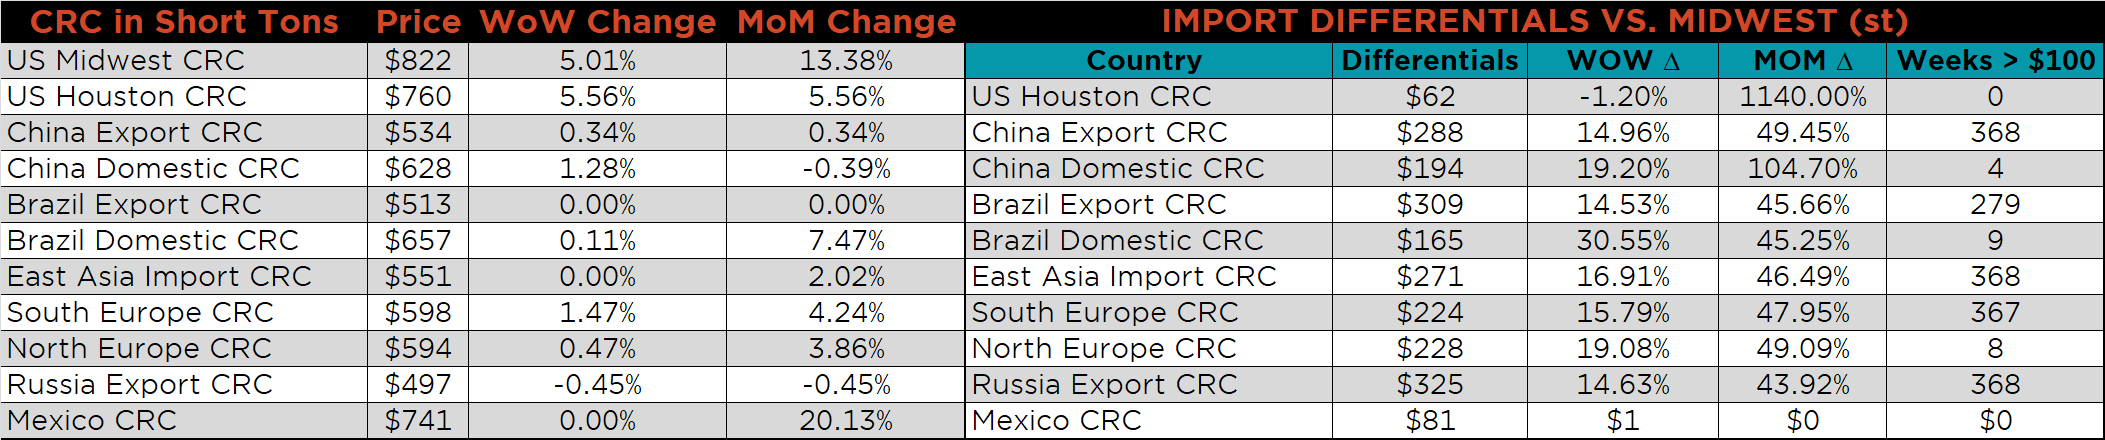
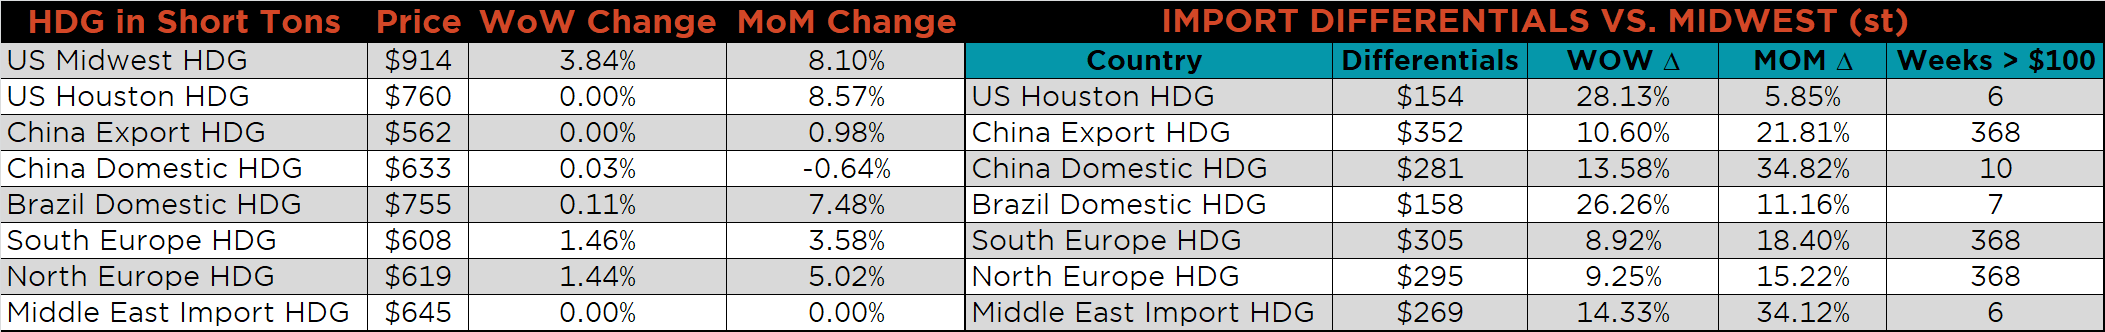
Below is the Midwest HRC price vs. each listed country’s export price using pricing from SBB Platts. We have adjusted each export price to include any tariff or transportation cost to get a comparable delivered price. The differentials for all watched countries increased dramatically again last week, as the U.S. price rose and global prices were unchanged or slightly lower. If this trend continues and domestic lead times remain at these historic levels, importing material will appear more attractive.
SBB Platt’s HRC, CRC and HDG pricing is below. The Midwest HRC, CRC and HDG prices were up, 5.6%, 5% and 3.8%, respectively. Globally, the Chinese domestic HRC and CRC prices were up 2% and 1.3%, respectively.
Raw material prices were mostly lower. November iron ore futures were up 4.1%, while Aussie coking coal was down 4.5%.
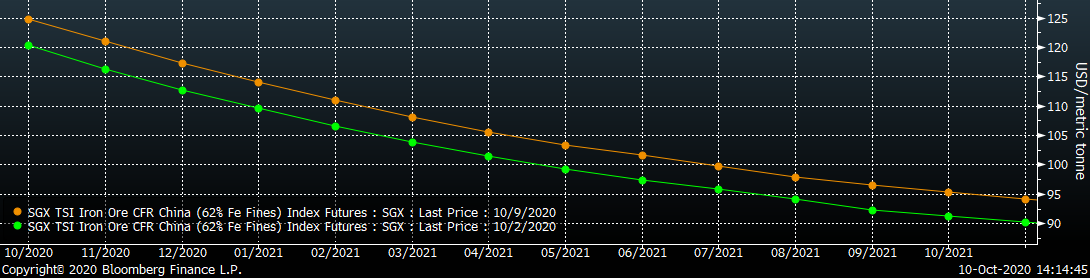
Below is the iron ore future curve with Friday’s settlements in orange, and the prior week’s settlements in green. Last week, the curve increased equally along all expirations.
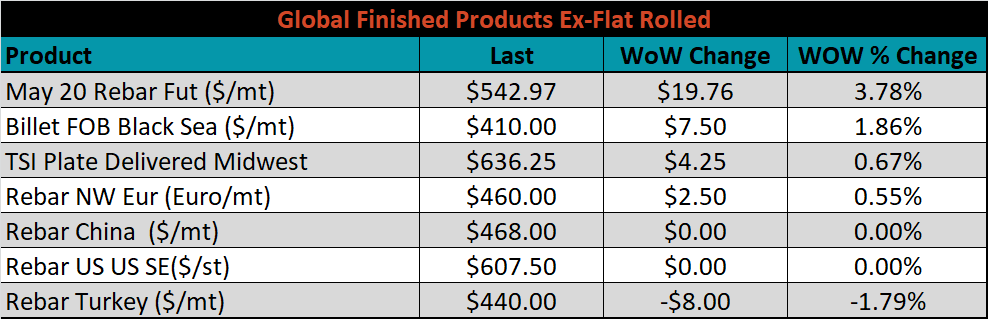
The ex-flat rolled prices are listed below.

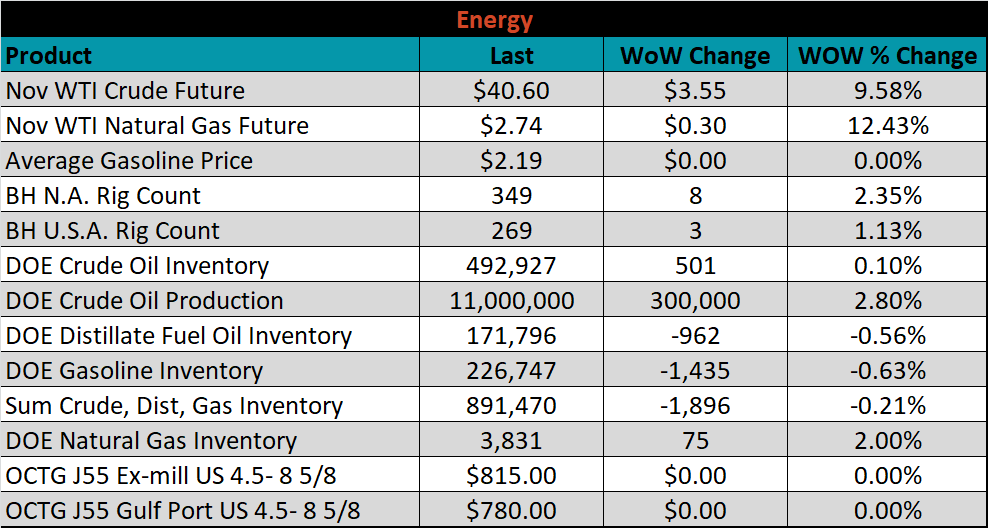
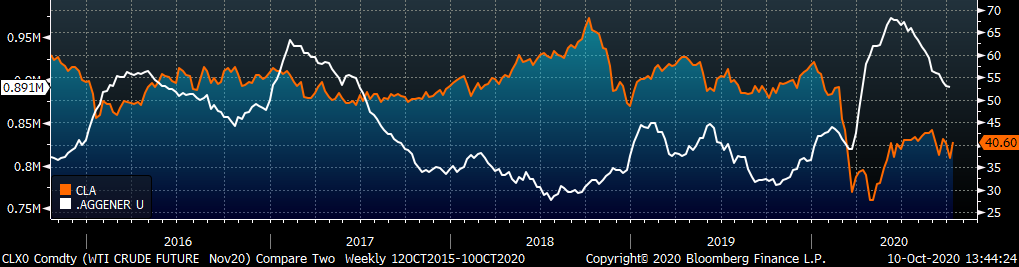
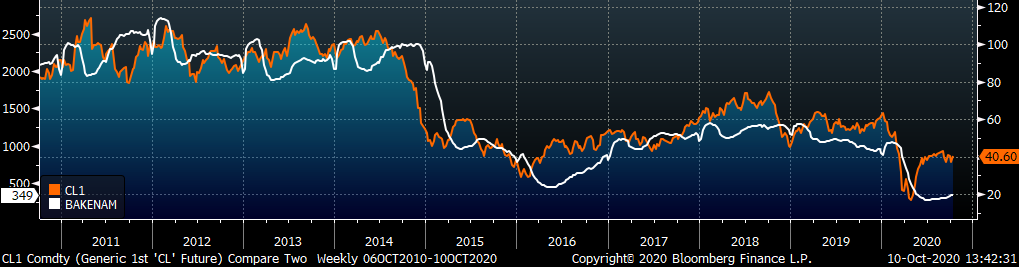
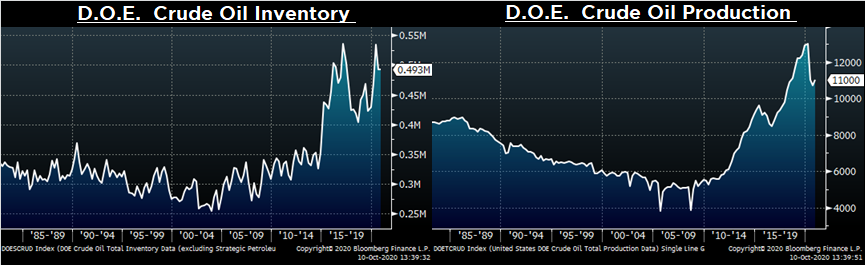
Last week, the November WTI crude oil future gained $3.55 or 9.6% to $40.60/bbl. The aggregate inventory level was down another 0.2%, while crude oil production rose to 11m bbl/day. The Baker Hughes North American was up 8 rigs and the U.S. rig count was up 3 rigs.
The list below details some upside and downside risks relevant to the steel industry. The orange ones are occurring or look to be highly likely. The upside risks look to be in control.
Upside Risks:
Downside Risks: