Content
-
Weekly Highlights
- Market Commentary
- Upside & Downside Risks


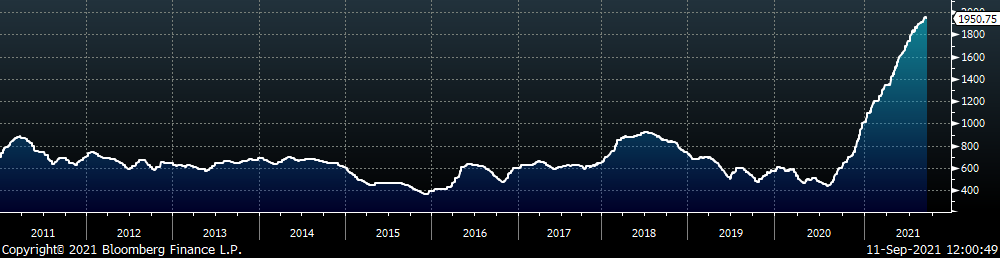
The drive higher for the domestic steel price lost additional momentum this week as bearish anecdotes continue to grow louder by the day. Now, the fever-pitch volume to claims that “the rally has ended” all but drown out another week of mixed fundamental signals, leading to further consolidation around the $1,950 level. The varied timelines around the short-term glut of supply from sustained auto shutdowns versus reduced production due to ongoing/upcoming outages appears to be establishing a stalemate for mills and buyers. Increasing inventories, recent declines in raw material prices, and weakening global HRC prices leave the U.S. domestic price further above its historical support structures than ever before. For months we have been pointing to roaring demand for steel as the driving force for the structural shortage as mills, importers, and service centers were desperate to keep up with orders, leading to the historic rally in prices. Now that we appear to be in the final stages of the upcycle, it is time to look at where downcycle support levels can occur. Historically, we have categorized downcycle moves as a grind lower (2004, 2011 & 2018), down and up (2010 & 2016) or a crash (2008). Our current outlook of strong demand through 2022 minimizes the risk of a crash or collapse in steel prices in our perspective, but in the remainder of the report, we will dig into recent movement on the CME HRC forward curve as a framework to discuss the two remaining possibilities.
Starting in the middle of last week and continuing early into the current week (ending on 9/17/2021), the future market started selling off in dramatic fashion. The chart below shows 4 futures curves, starting with the beginning of July in orange, the first week of September in green, last Friday in white, and finally this Wednesday, 9/15/2021 in dotted yellow.
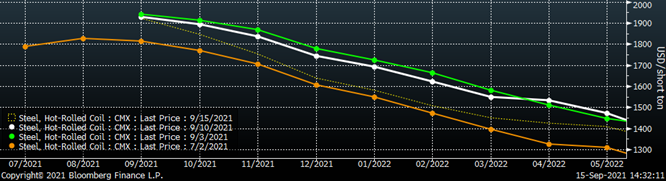
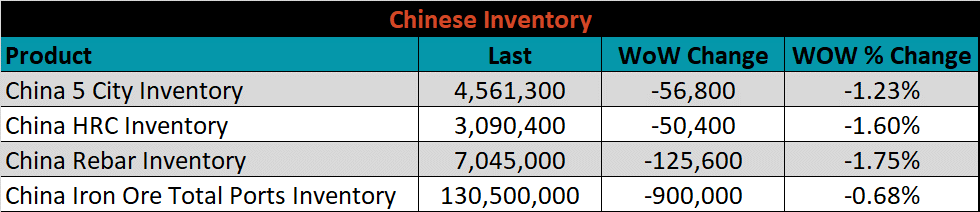
Here we see the gap between the physical spot market and financial market expand dramatically in one week’s time. After selling off, 1Q22 now represents a $450 discount to today’s spot price, averaging about $1,500, which matches recent import offers for 1Q22 arrival. The fact the futures and imports are now in line is a signal that has not been seen in months, so what does it mean? The recent inventory build across sectors cannot be overlooked, and while inventories remain below historic levels, the diminished urgency to pay any price for material today is the reason for slowed momentum. With the broad market anticipating the highest levels of imported steel since pre-232 tariffs to be arriving in the first quarter, this is an obvious support level for the domestic market price.
On the other side of the equation, most planned outages have only just begun and the assumption of prices falling as rapidly as the futures curve would suggest is predicated largely on sustained spot availability and mills restarting furnaces on schedule to chase orders at lower prices. While record levels of profitability make this is a possibility, domestic producers have consolidated and recent comments from decision makers at those mills suggest a clear willingness to extend outages and cut production to keep prices elevated. If the expectation of a fast move lower in the domestic market leads to a reluctance to purchase imports, this will only increase mills leverage to keep prices elevated.
Below are the most pertinent upside and downside price risks:
Upside Risks:
Downside Risks:
The Platts TSI Daily Midwest HRC Index decreased by $5.75 to $1,950.75.
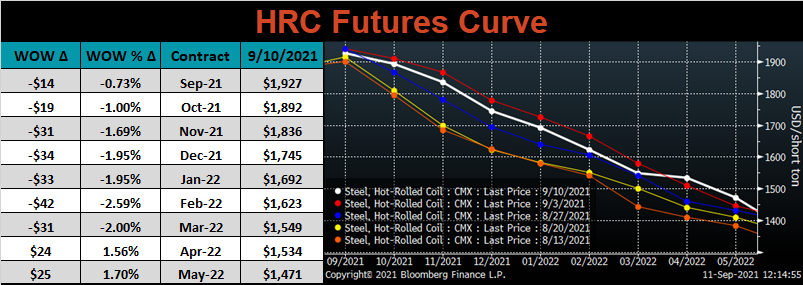
The CME Midwest HRC futures curve is below with last Friday’s settlements in white. At the end of last week, 4Q21 and 1Q22 sold off, while surprisingly, further out expirations in 2022 increased. The flattening of the forward curve in 2022 could be a sign that long awaited mill contracts are nearing completion.
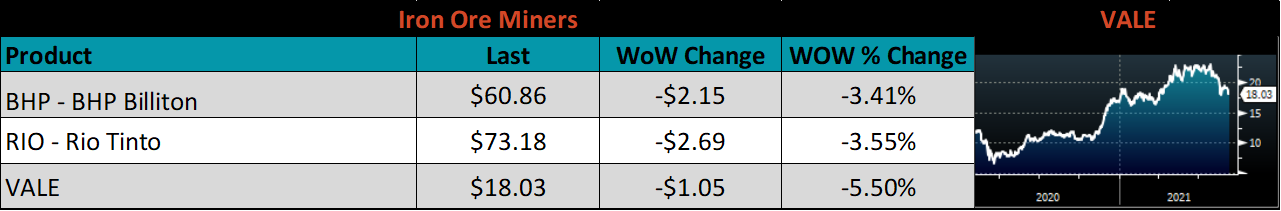
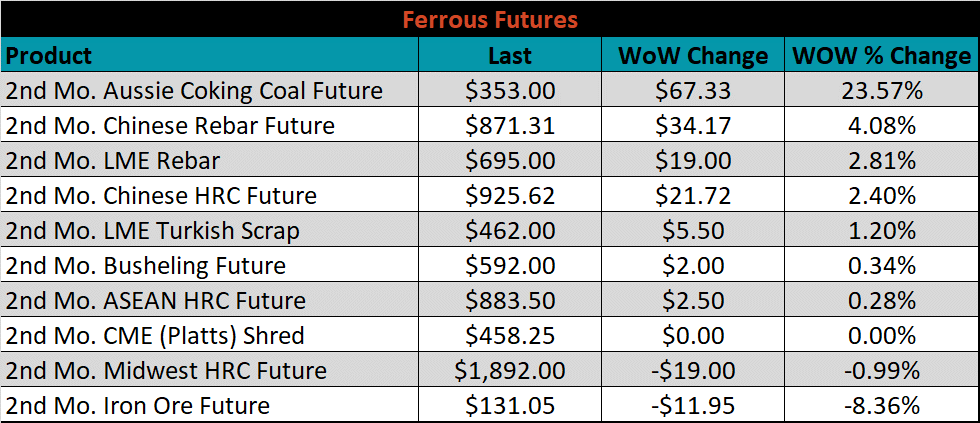
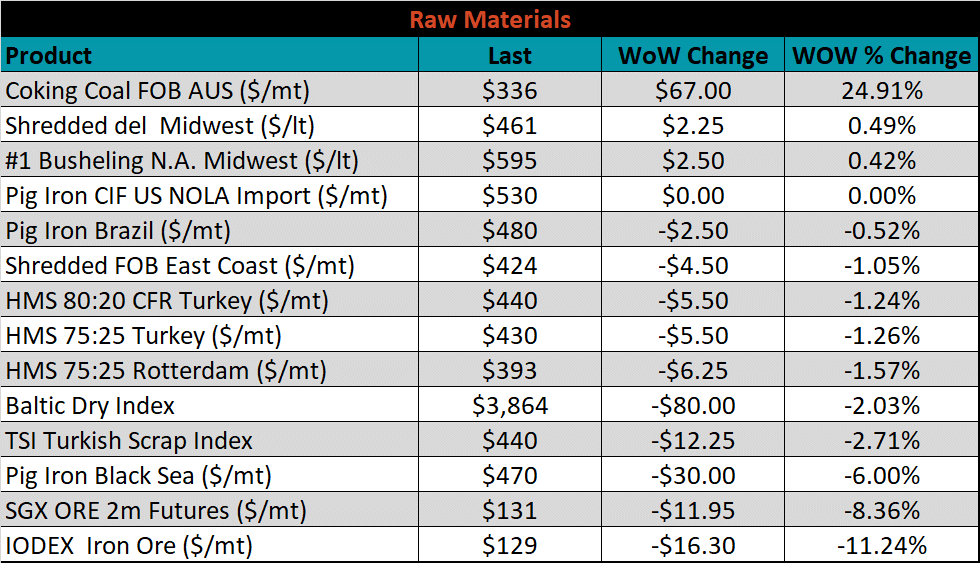
October ferrous futures were mostly higher, led by Aussie coking coal, which gained 23.6%, while iron ore lost another 8.4%.
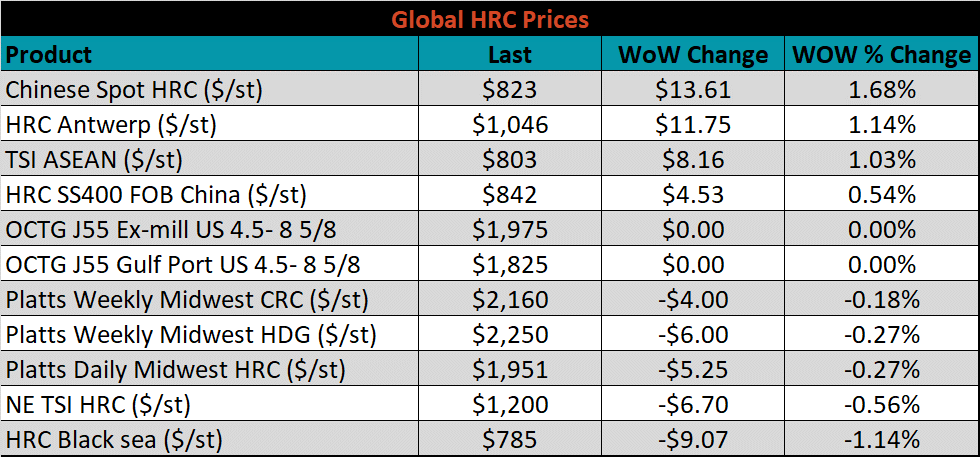
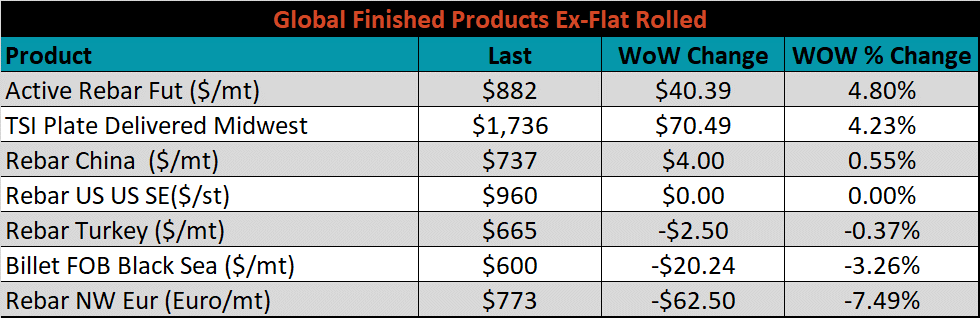
Global flat rolled indexes were mixed. The Chinese spot HRC price was up another 1.7%, while Black Sea HRC was down another 1.1%.
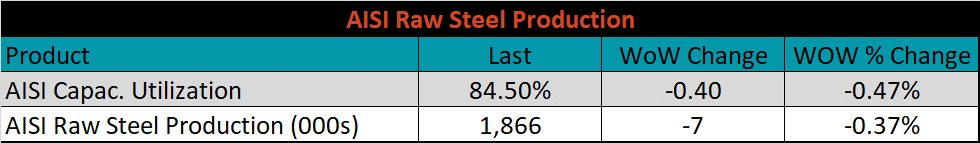
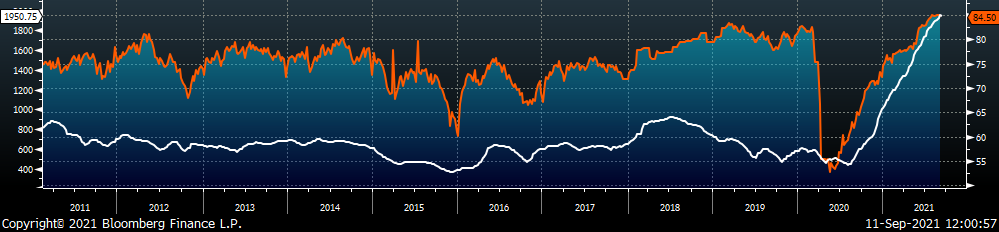
The AISI Capacity Utilization rate decreased 0.4% to 84.5%.
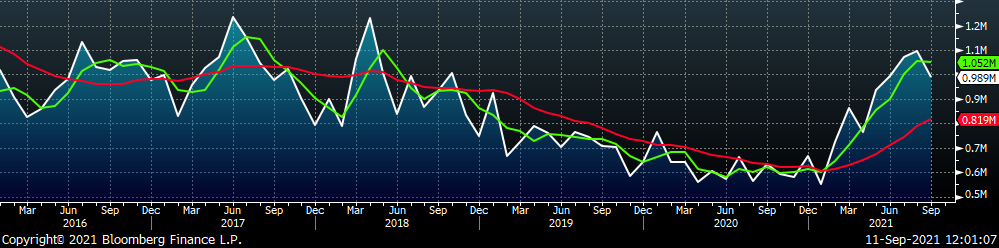
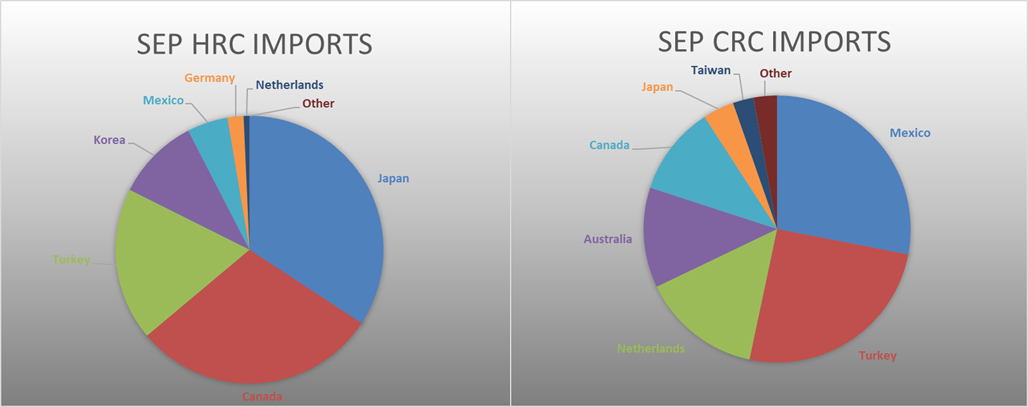
September flat rolled import license data is forecasting a decrease of 108k to 989k MoM.
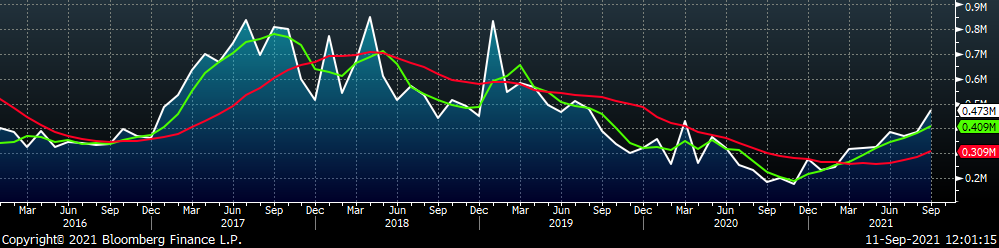
Tube imports license data is forecasting an increase of 87k to 473k in September.
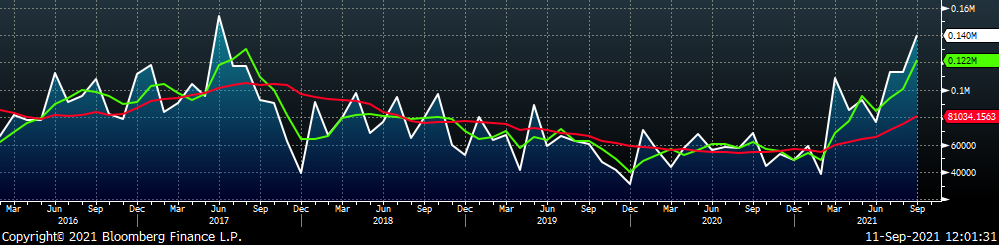
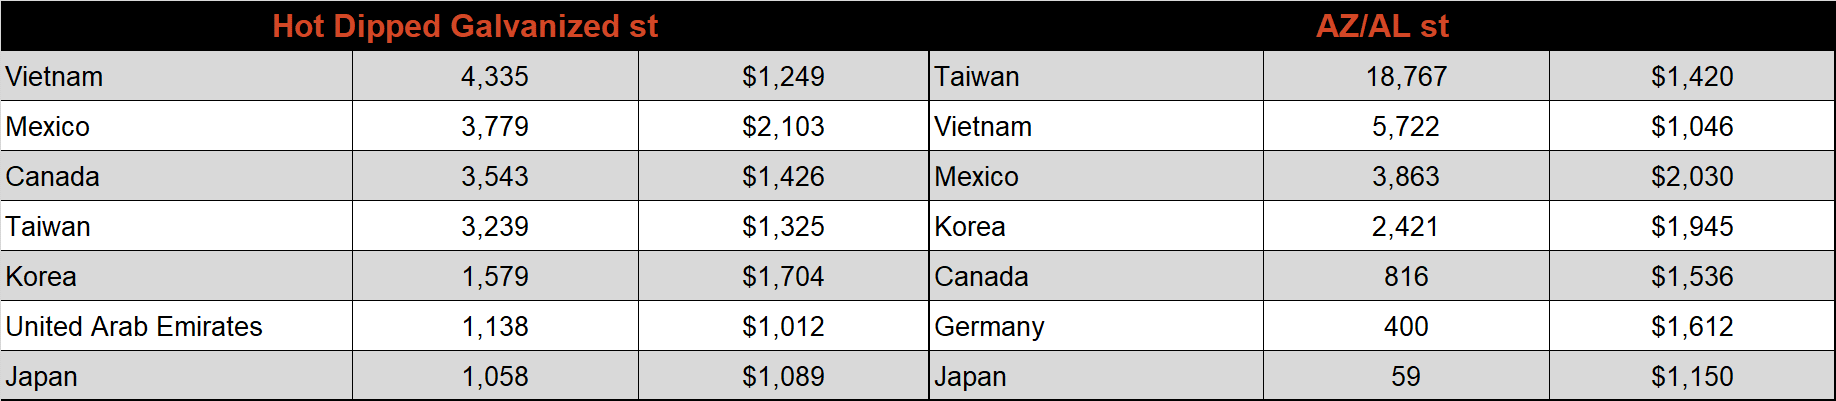
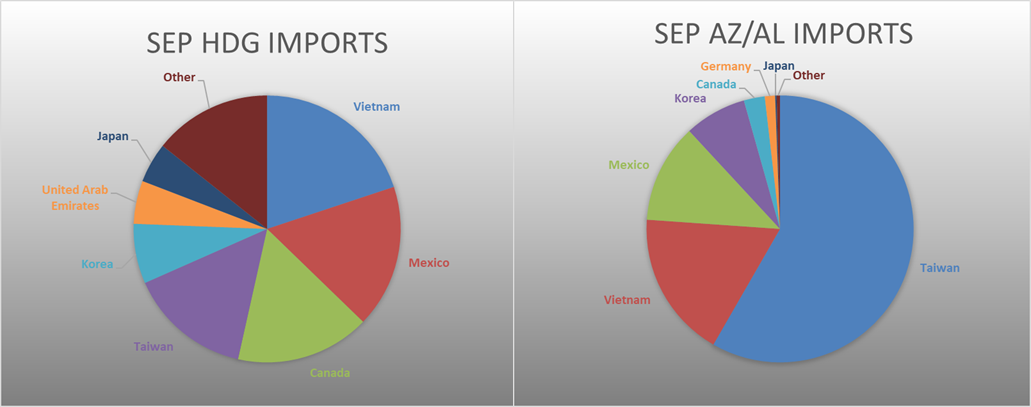
September AZ/AL import license data is forecasting an increase of 27k to 140k.
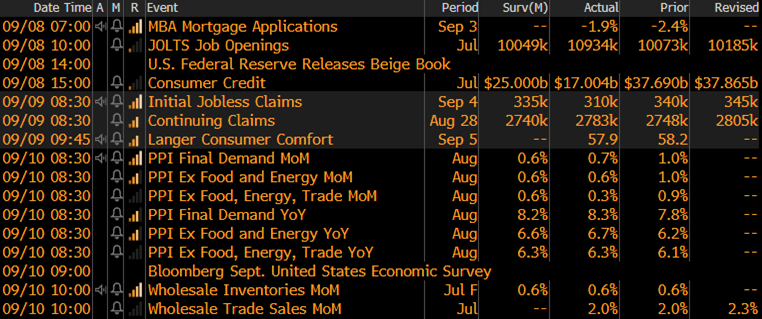
Below is September import license data through September 6th, 2021.
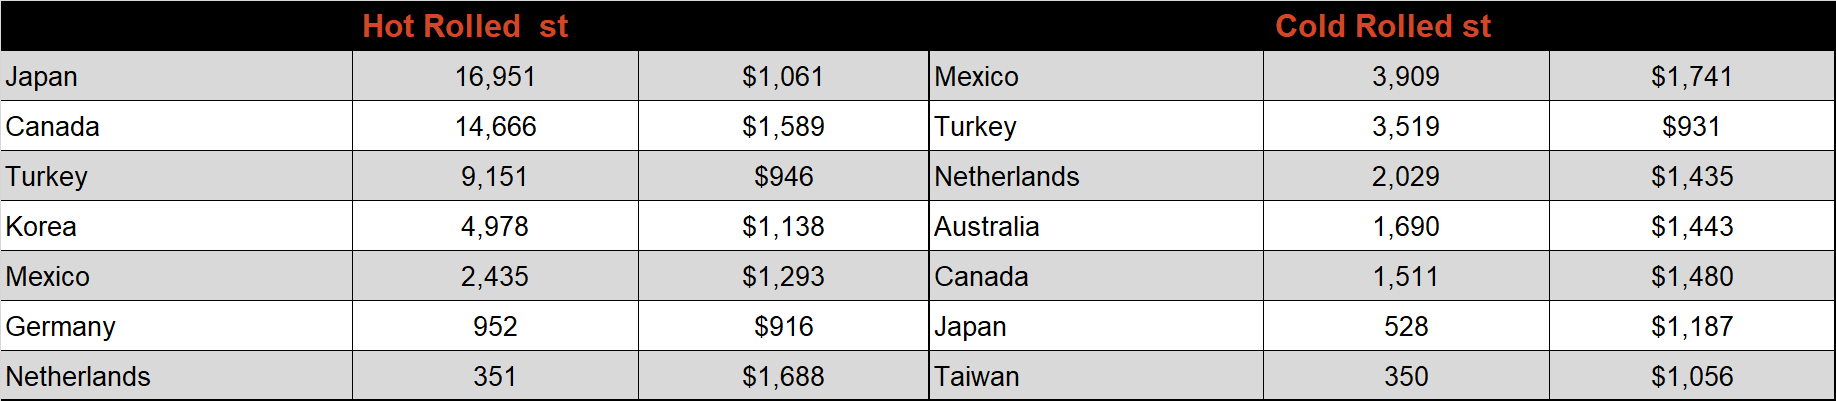
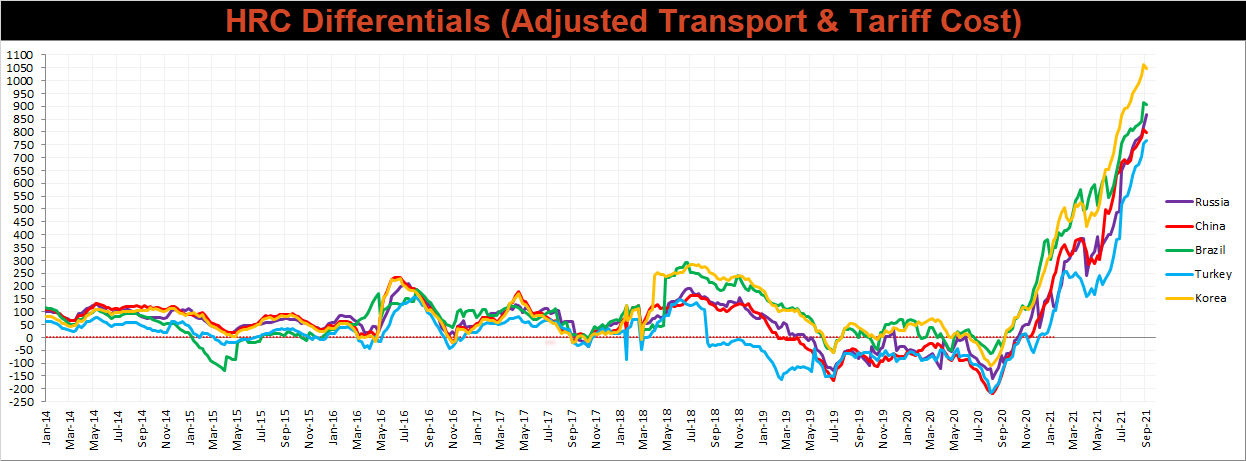
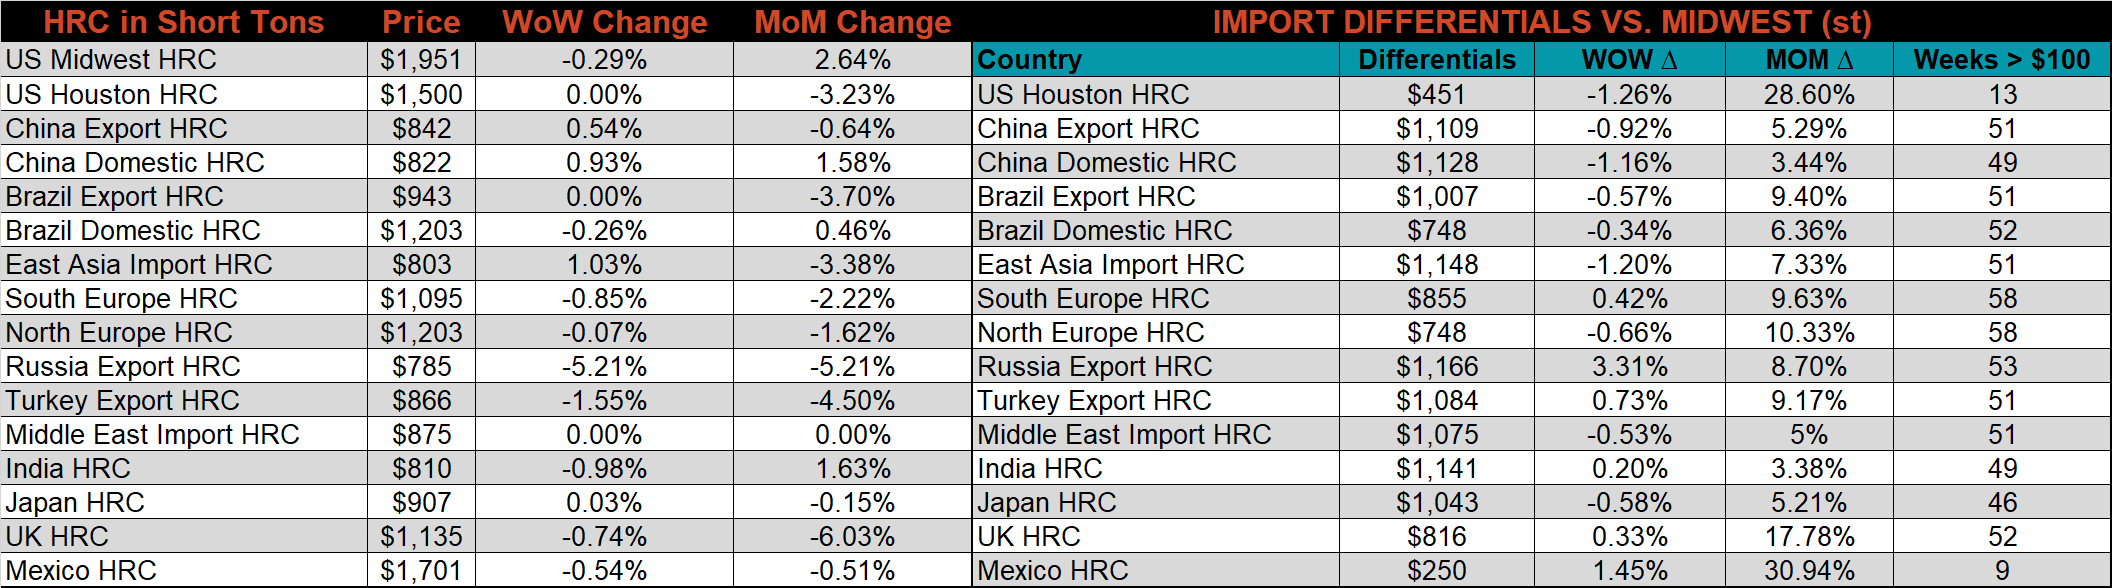
Below is the Midwest HRC price vs. each listed country’s export price using pricing from SBB Platts. We have adjusted each export price to include any tariff or transportation cost to get a comparable delivered price. Differentials decreased slightly for China, Brazil, and Korea this week, as the U.S. price slipped.
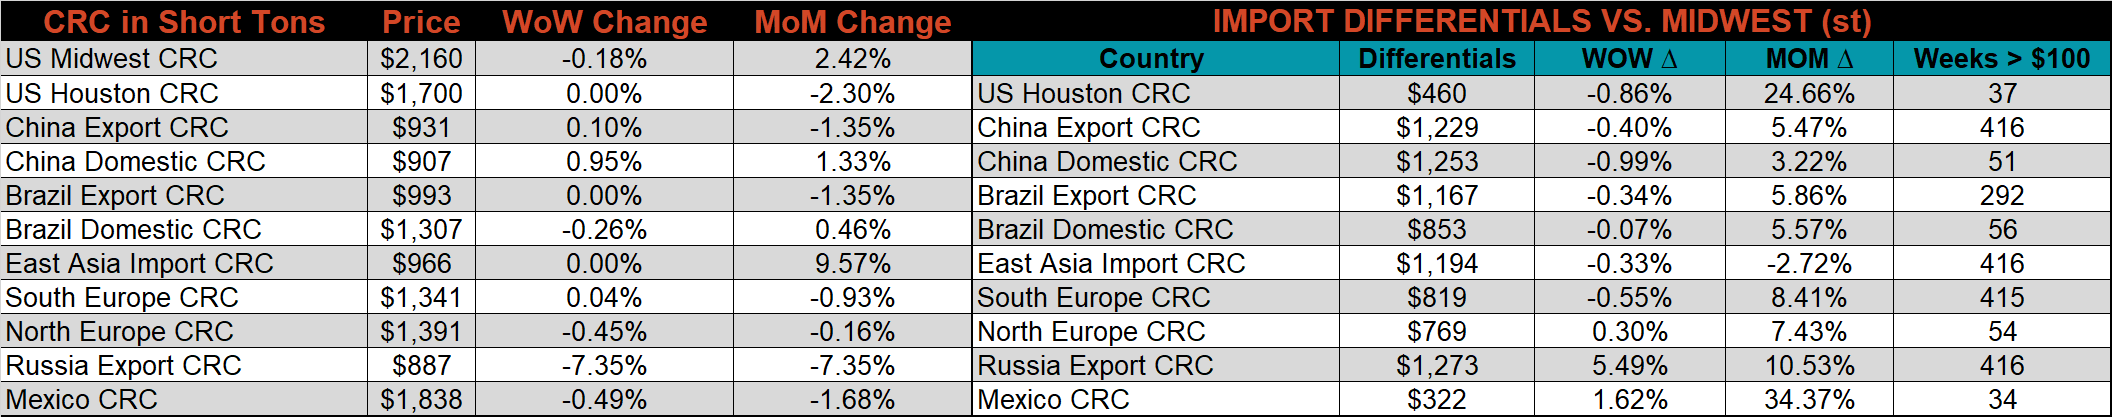
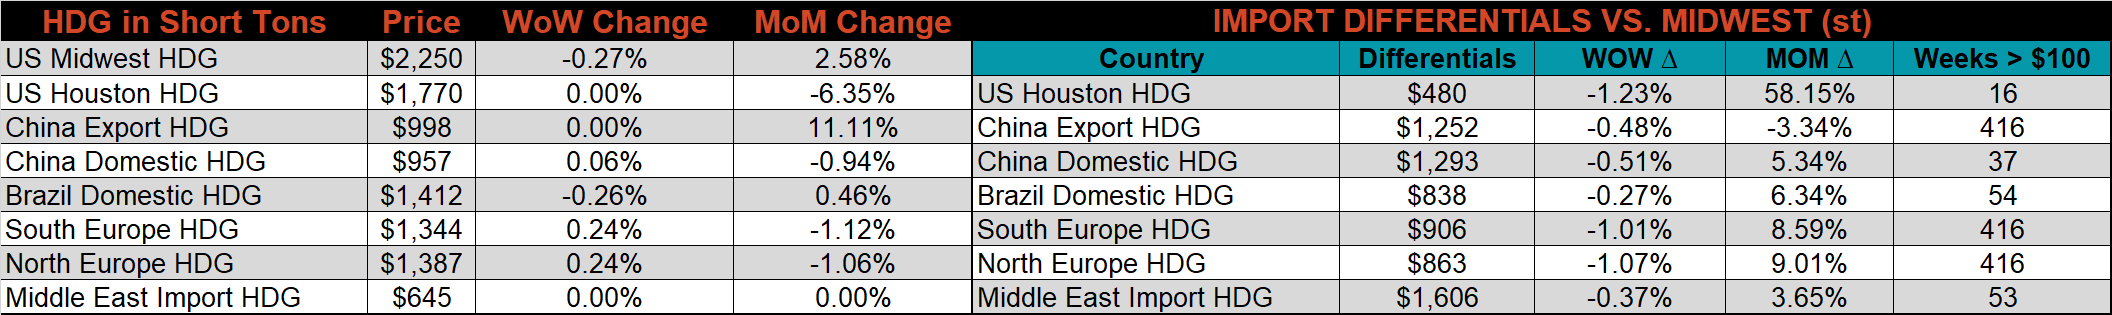
SBB Platt’s HRC, CRC and HDG pricing is below. The Midwest HRC, HDG, & CRC prices were down by 0.3%, 0.3%, and 0.2%, respectively. Outside of the U.S., the Russian CRC & HDG export prices were down 7.4% and 5.2%, respectively.
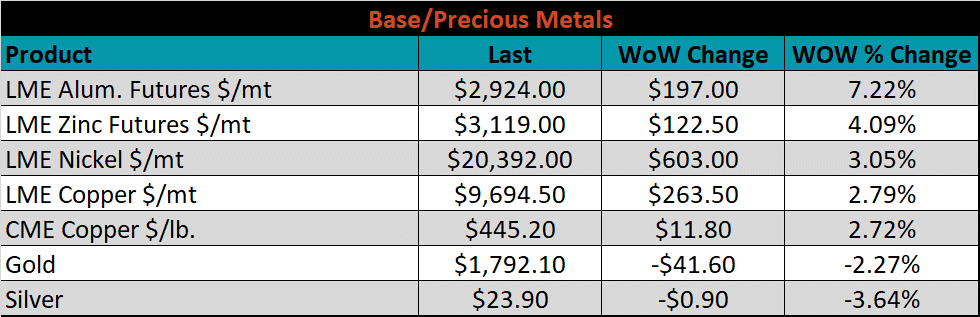
Raw material prices were mostly lower, led by the IODEX iron ore index, down another 11.2%, while Aussie coking coal gained 24.9%.
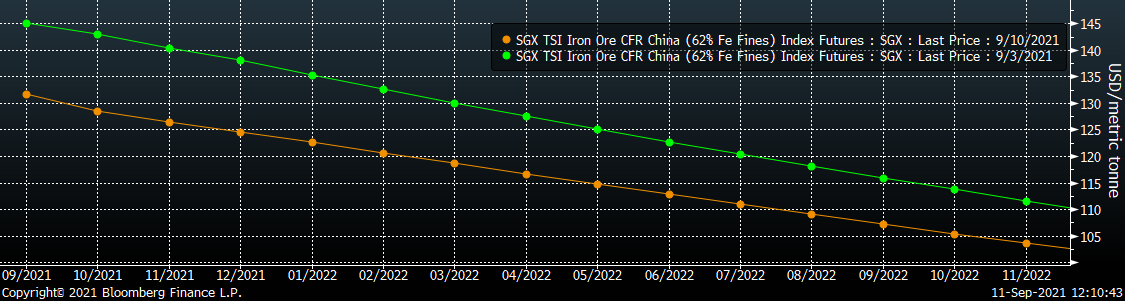
Below is the iron ore future curve with Friday’s settlements in orange, and the prior week’s settlements in green. Last week, the entire curve shifted lower again, most significantly in the front. Since it’s peak on July 16th, the October future is down $75.56 or 37%.
The ex-flat rolled prices are listed below.

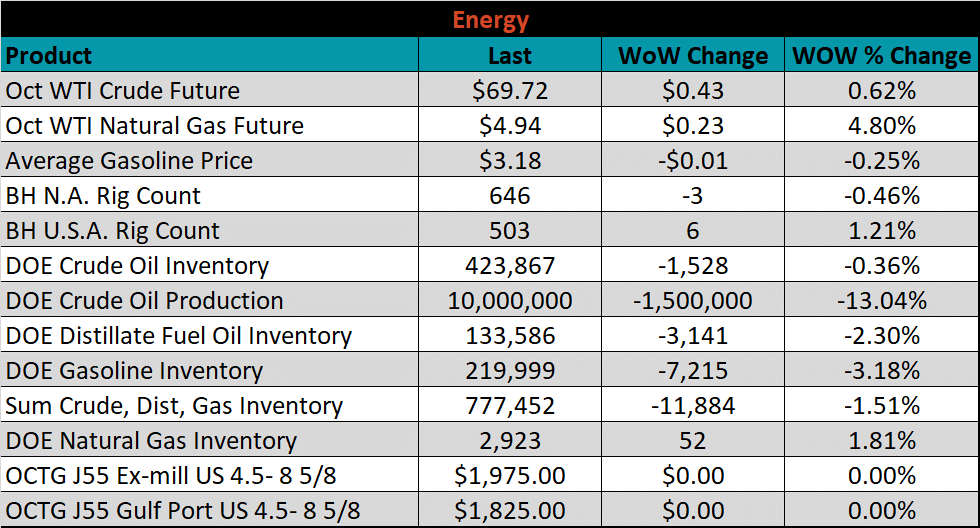
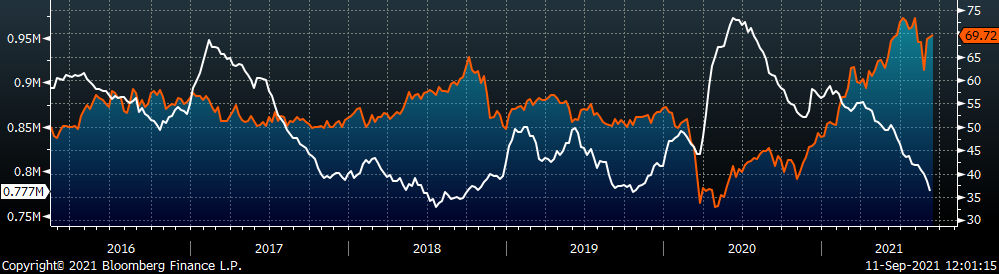
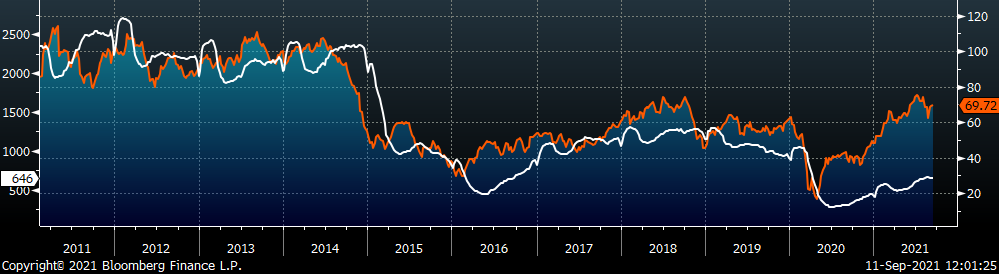
Last week, the October WTI crude oil future was up $0.43 or 0.6% to $69.72/bbl. The aggregate inventory level was down another 1.5%, and crude oil production decreased significantly to 10m bbl/day. The Baker Hughes North American rig count was down another 3 rigs, while the U.S. rig count was up 6 rigs.
The list below details some upside and downside risks relevant to the steel industry. The bolded ones are occurring or highly likely.
Upside Risks:
Downside Risks: