Content
-
Weekly Highlights
- Market Commentary
- Durable Goods
- Risks


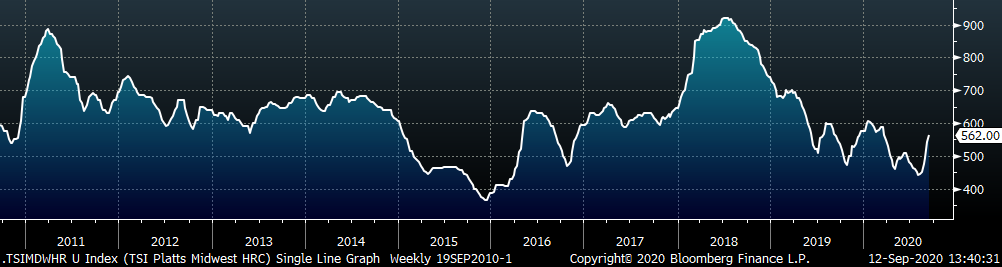
HRC prices continued to rally last week, with spot prices moving firmly above $550 and upside momentum intact. ArcelorMittal “unofficially” announced a price increase last week, targeting $600 HRC. Nucor and other mini mills followed, but the market consensus was that the spot prices was slightly below that level. On Monday, US Steel officially announced a $60/st increase, solidifying the new spot price at $600. Despite increased volatility in the price, activity in the spot market at mills has been depressed for two main reasons:
This pushes those buyers who are willing and able to pay higher prices to service centers that are able to deliver the needed inventory quickly. However, this drives inventory levels across the supply chain down, as mills are still producing at reduced rates, and continues to support the price rally. This week, we will dive into additional factors needed to push prices above $600, which was the peak price in the two previous price cycles of 2019.
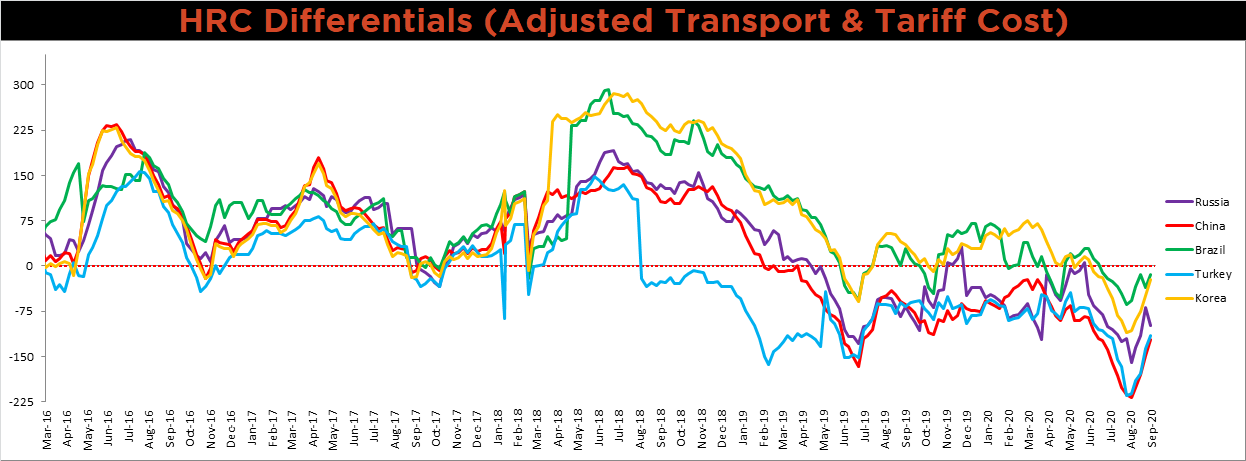
To understand the current price rally, we must first examine the dislocations created during the coronavirus pandemic that laid the foundation for this upcycle. As mentioned above, domestic production and utilization rates remain depressed, after mills took drastic steps in the spring to match supply with diminished demand. Another dislocation, which is related to production levels, was the collapse of the metals spread – HRC price minus scrap price. As global commodity prices, including US HRC prices, plummeted in the spring, scrap prices actually increased as limited steel scrap was created due to the economic shutdowns. This pushed the metal spread significantly below the historical average until just recently when the relationship normalized. The China export price differential was has also normalized after its recent dislocation. The below chart of this historical differential shows the domestic HRC price minus the China export price, including transportation costs.
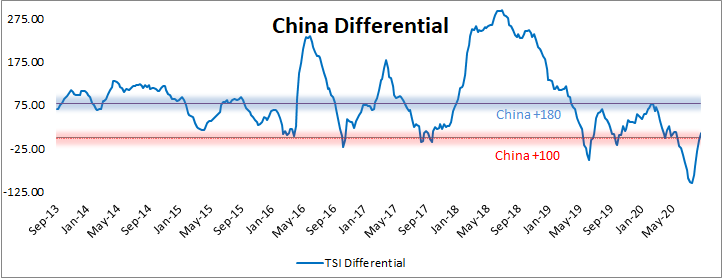
The origin, nature and spread of Covid-19 in itself create geographic dislocations that uniquely influence numerous industries and prices. While the Chinese economy was the first economy affected by the pandemic, it was also the first, and quickest, to recover. The recovery has been substantial, and specific stimulus measures considerably supported the industrial metals sector recovery i.e. steel prices. However, domestic prices continued to fall throughout the summer, creating an abnormal convergence in price. Over the past few weeks, this relationship has normalized closer to its historical average, signaling that factors that historically drove the domestic price may be returning to importance. This brings us to the question – What is needed to drive prices above $600? Based on these normalized relationships, we see further increases in scrap prices, continued global HRC price strength, and restocking across the domestic supply chain as the most important conditions needed to push prices higher. However, there are prevalent downside risk, centered around dislocations that have not yet normalized. Specifically, it will be difficult for prices to continue significantly higher if production levels return to the pre-pandemic levels, and if supply chain disruptions ease, driving commodity prices, namely iron ore, back down to sustainable levels.
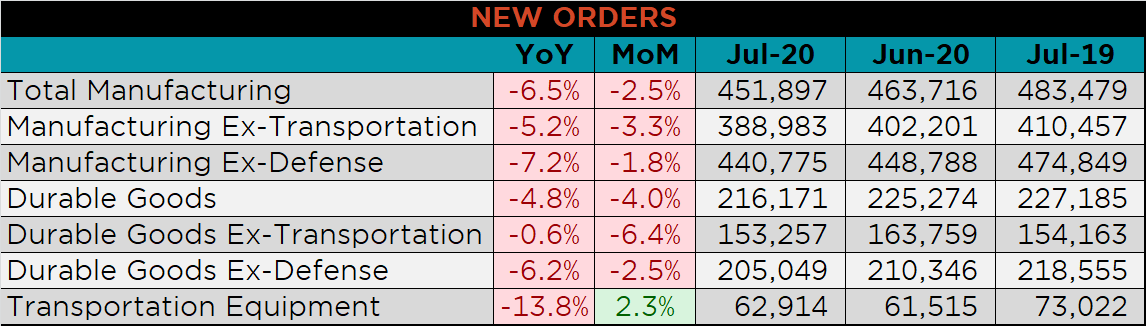
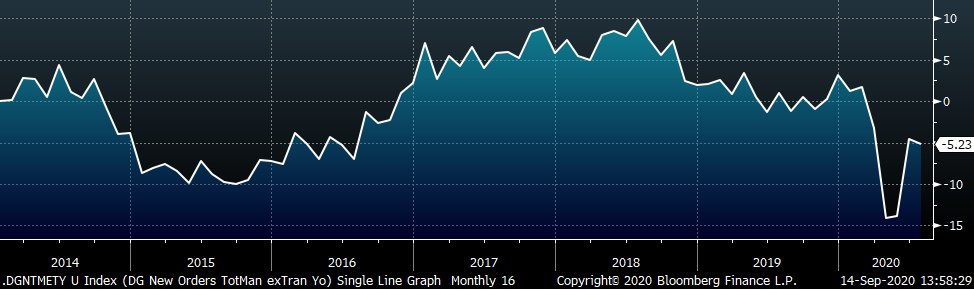
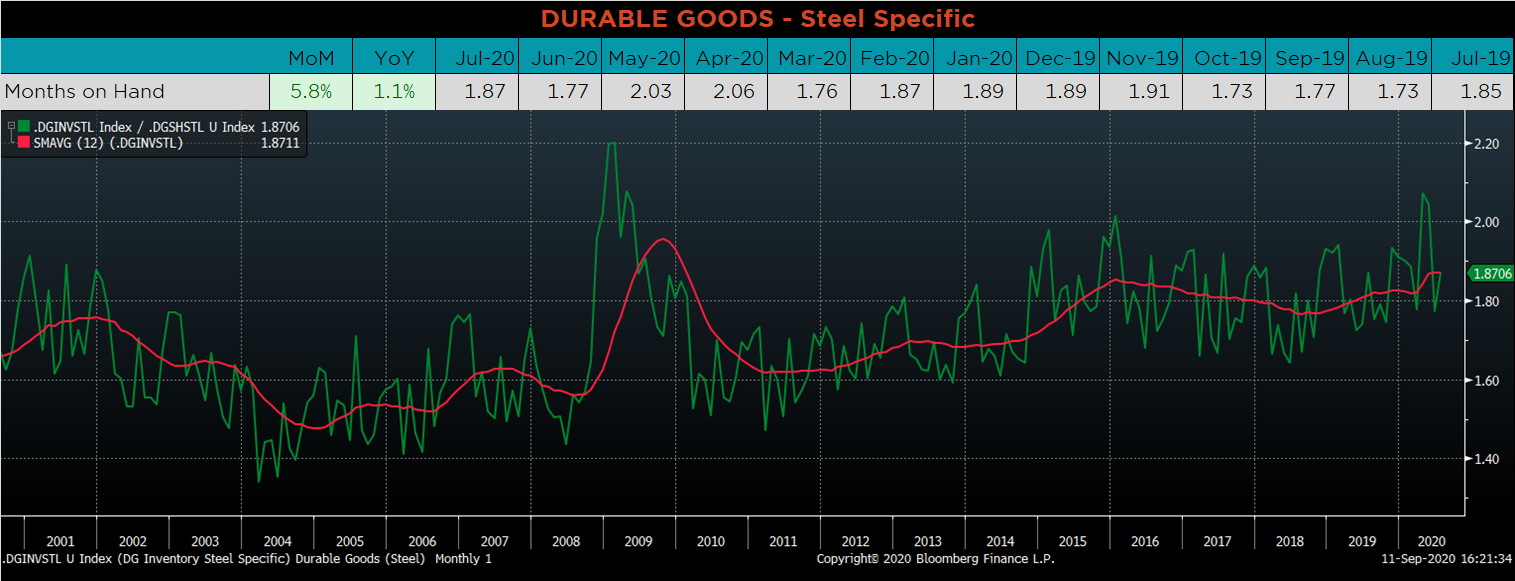
Below are final July new orders from the Durable Goods report. New orders for manufactured goods were down MoM and YoY. Manufacturing new orders ex-transportation decreased 5.2% YoY. The final chart looks at the months on hand (inventory divided by shipments) for durable goods categories that are steel intensive. Both monthly shipments and inventories decreased, but MoH were higher, as monthly shipments decreased more dramatically.
Below are the most pertinent upside and downside price risks:
Upside Risks:
Downside Risks:
The Platts TSI Daily Midwest HRC Index jumped again, up $21.5 to $562.
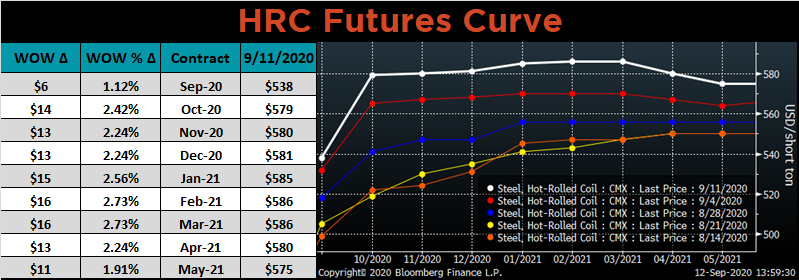
The CME Midwest HRC futures curve is below with last Friday’s settlements in white. The entire curve shifted another $10-15 higher this week.
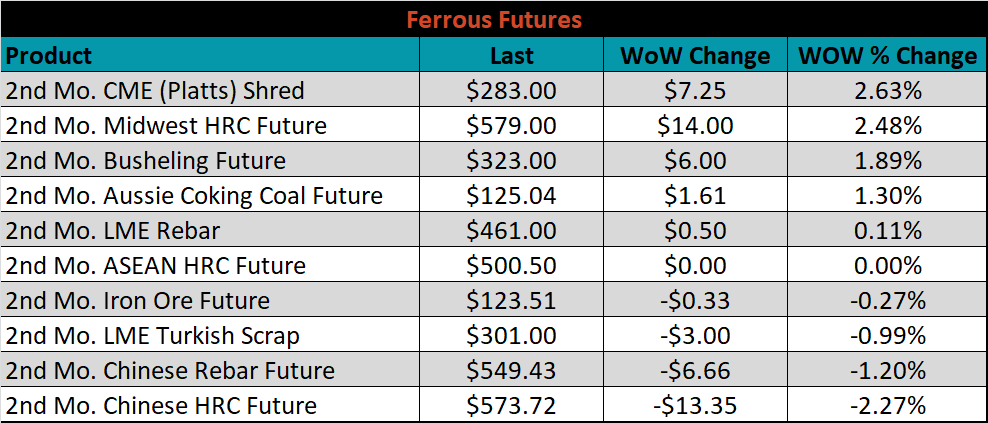
October ferrous futures were mixed. Platts shred gained 2.6%, while Chinese HRC lost 2.3%.
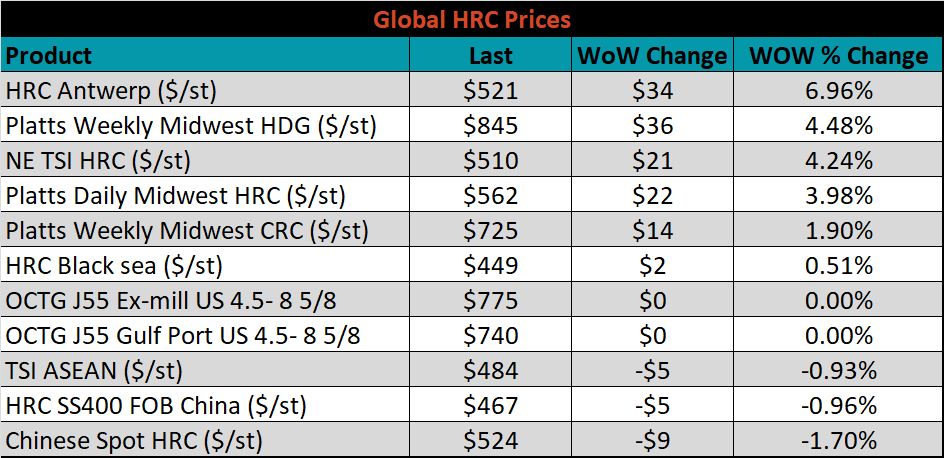
The global flat rolled indexes were mixed. Antwerp HRC was up 7.0%, while the Chinese spot price was down 1.7%.
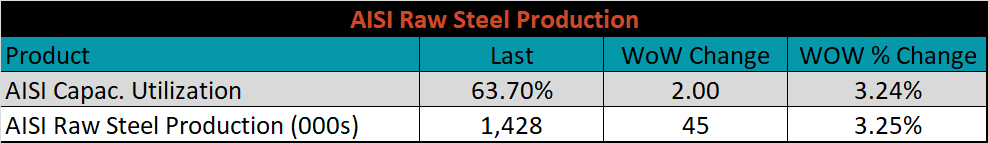
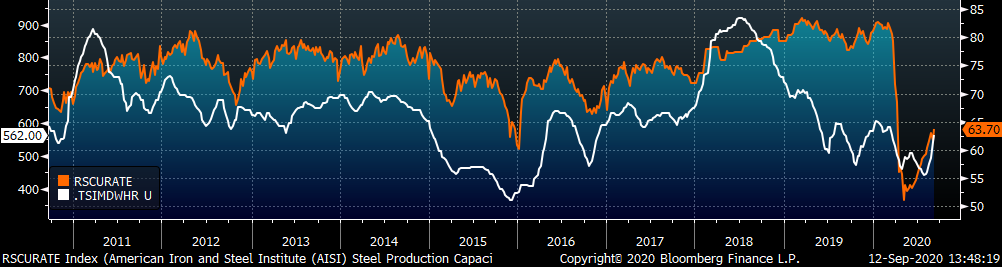
The AISI Capacity Utilization rate was up 2% to 63.7%.
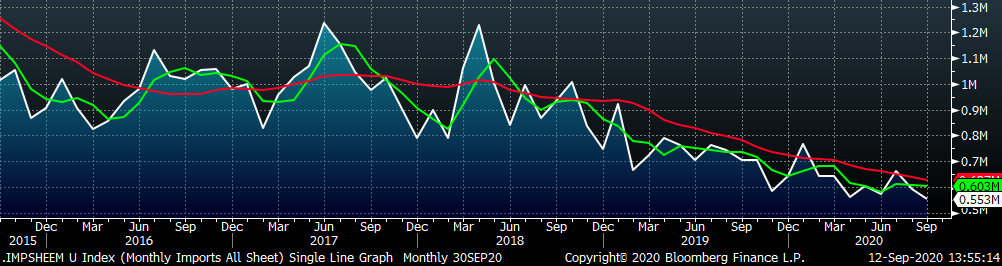
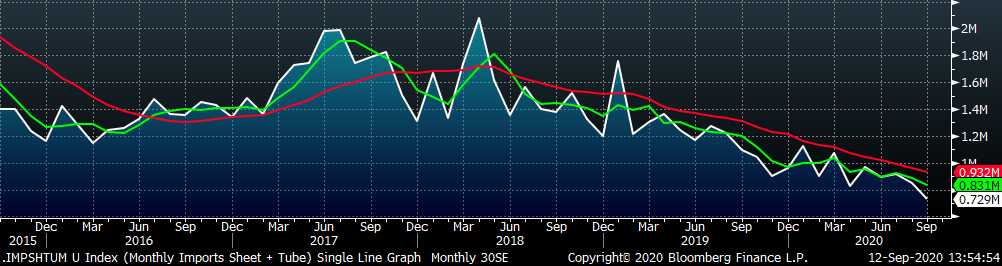
September flat rolled import license data is forecasting a decrease of 40k to 553k MoM.
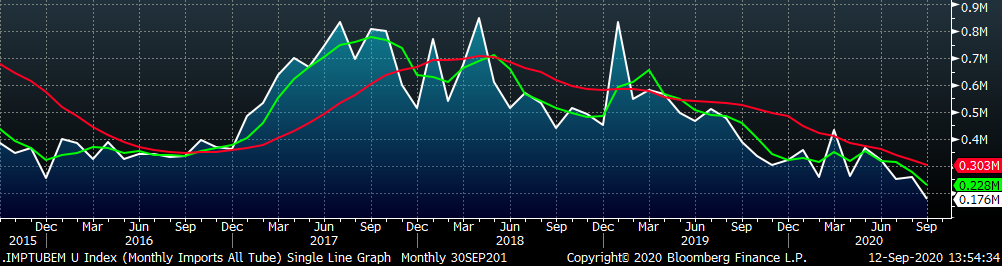
Tube imports license data is forecasting a decrease of 82k to 176k in September.
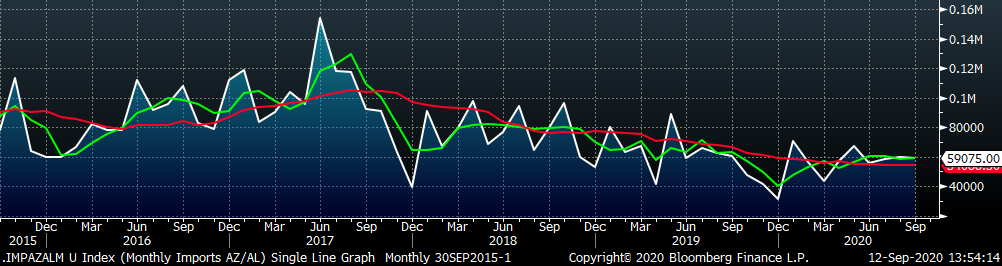
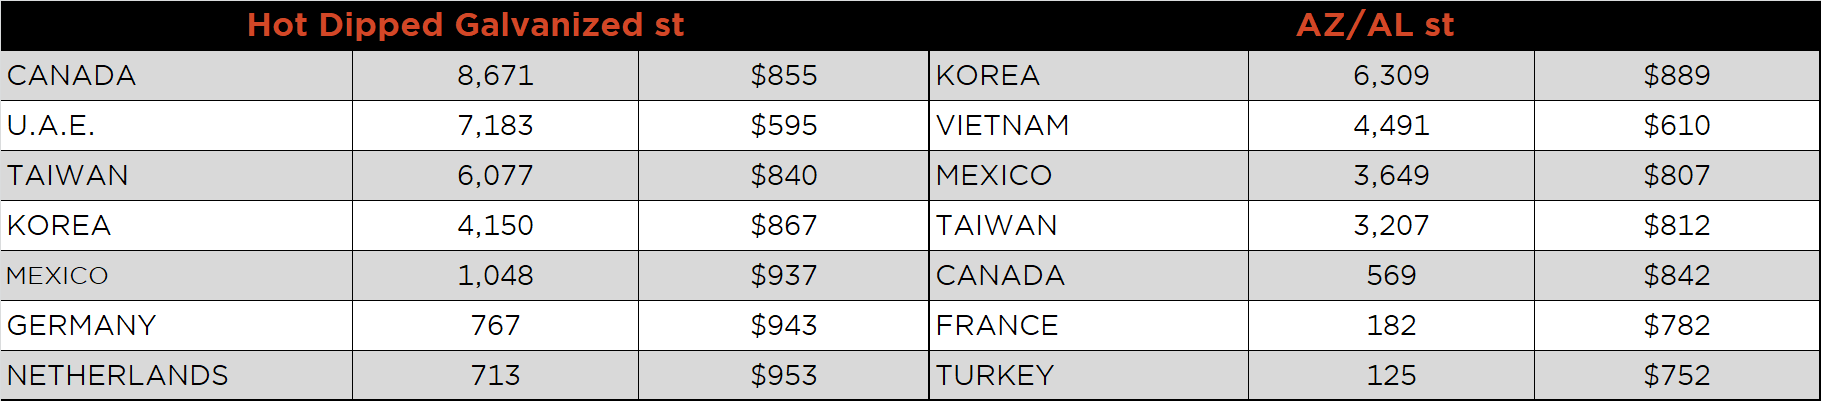
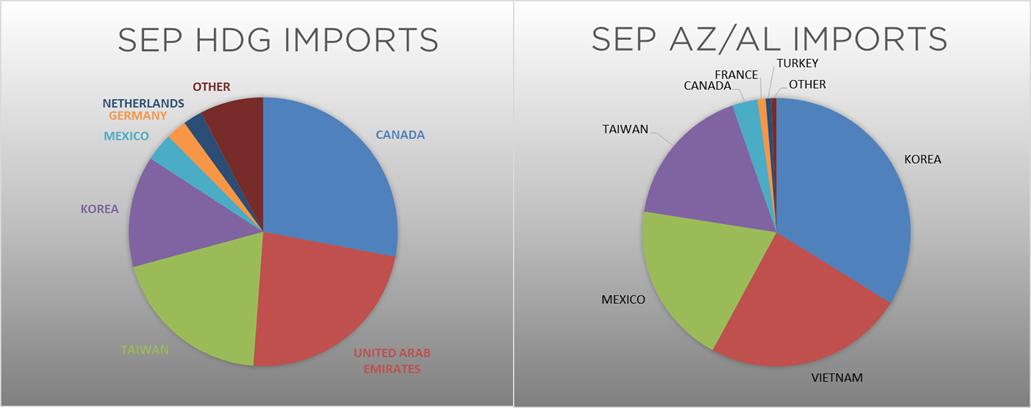
September AZ/AL import license data is forecasting a 1k decrease to 59k.
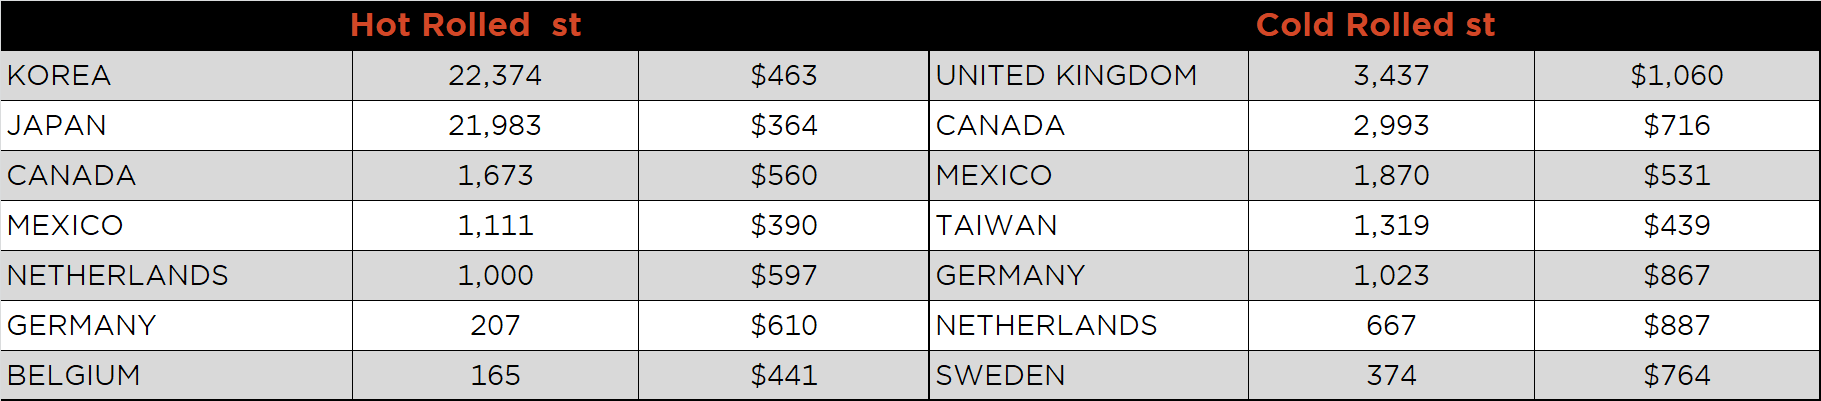
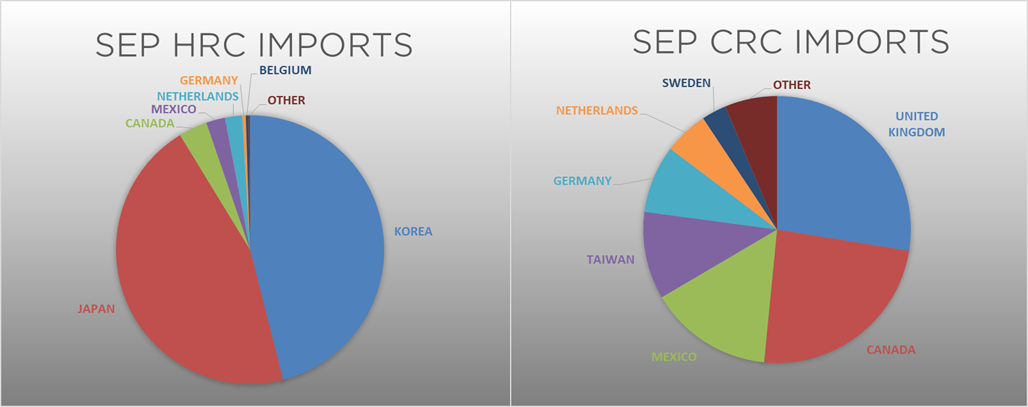
Below is September import license data through September 8, 2020.
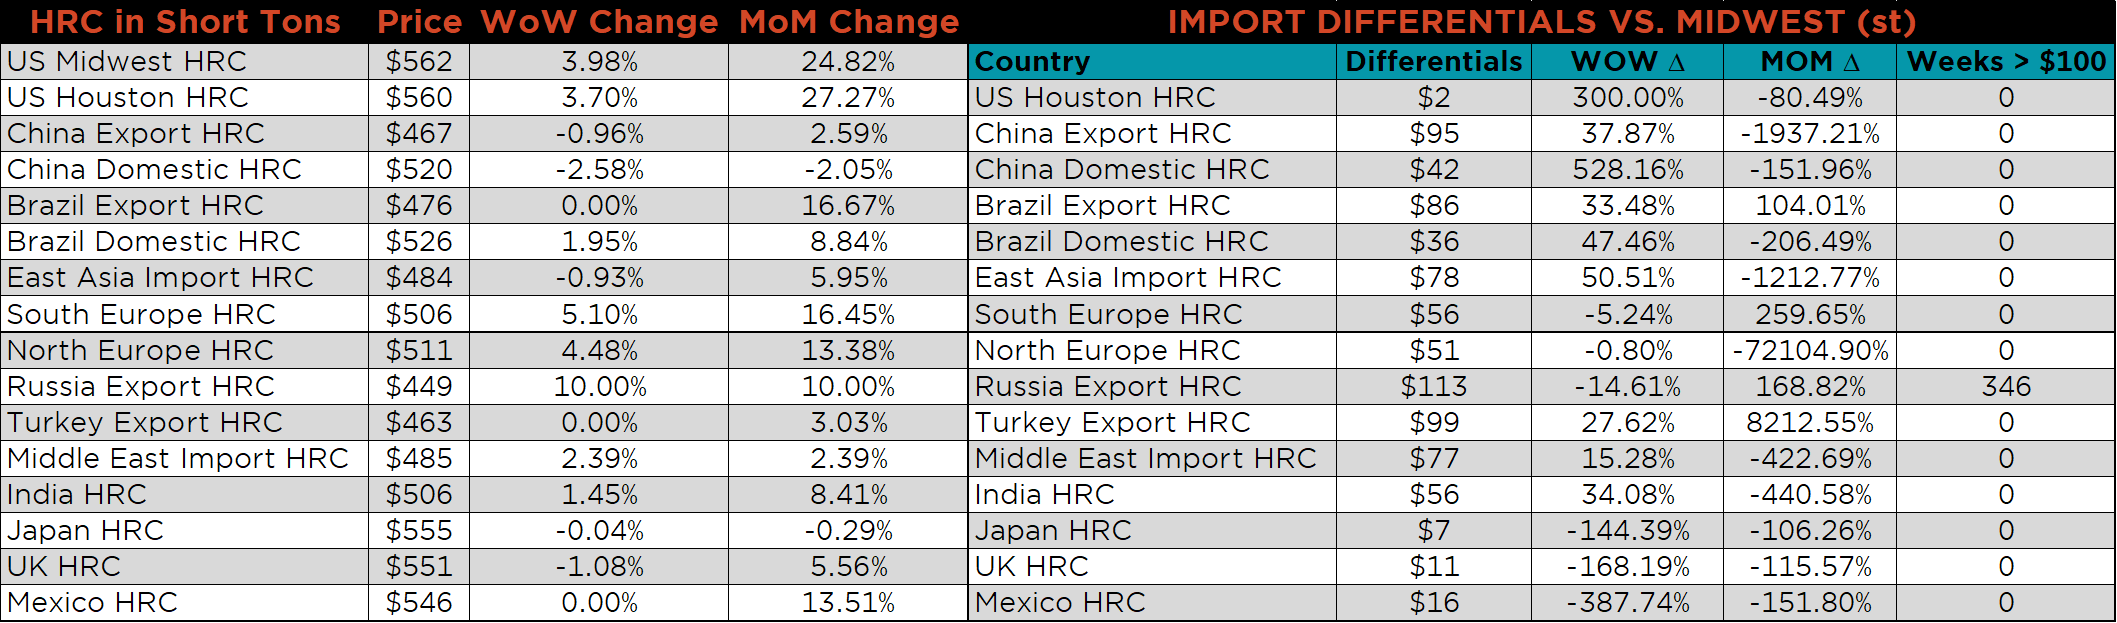
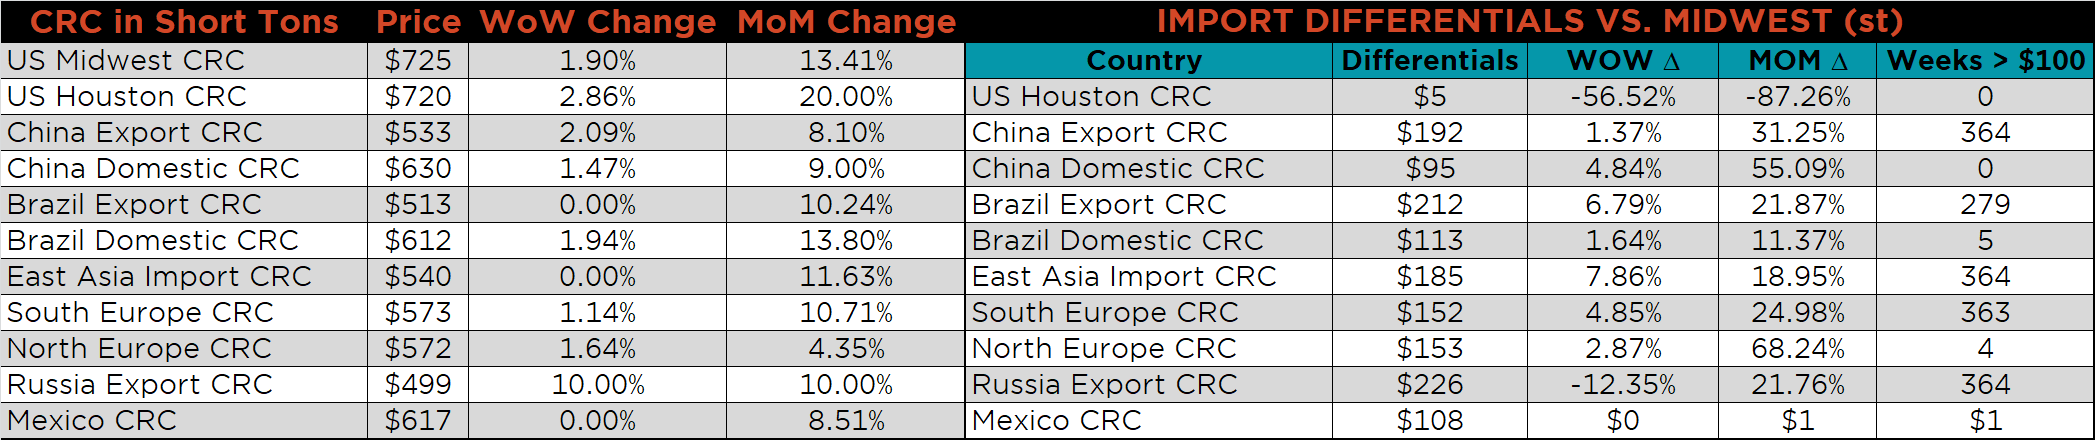
Below is the Midwest HRC price vs. each listed country’s export price using pricing from SBB Platts. We have adjusted each export price to include any tariff or transportation cost to get a comparable delivered price. The Russian differential fell significantly this week, as the Russian price outpaced the U.S. domestic price. For all remaining countries, the differentials increased as the U.S. price continues to climb.
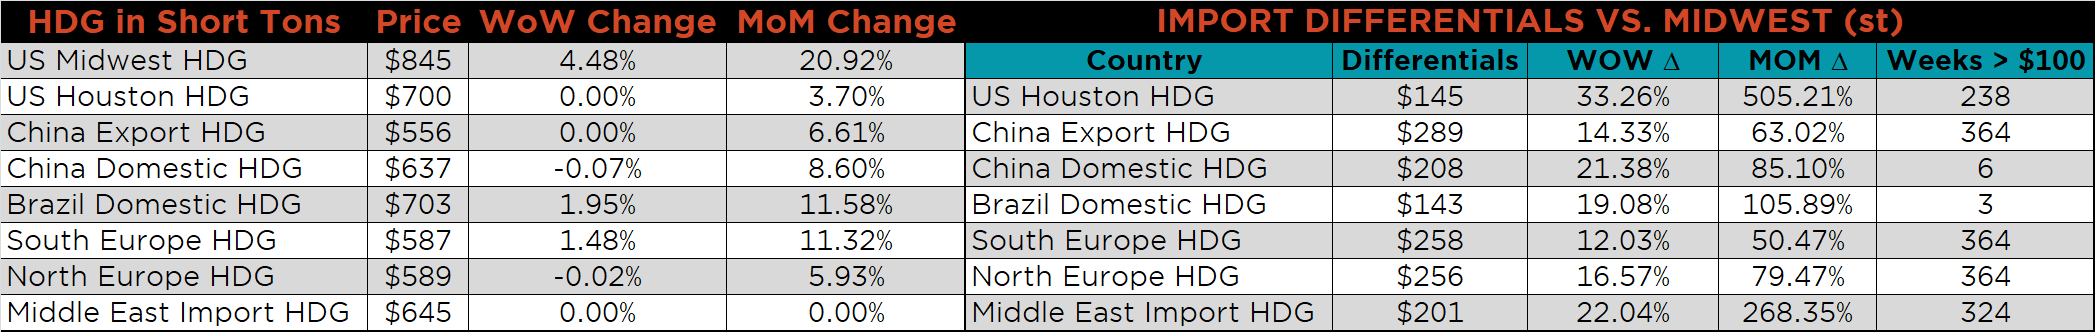
SBB Platt’s HRC, CRC and HDG pricing is below. The Midwest HDG, HRC and CRC prices were up, 4.5%, 4% and 1.9%, respectively. Globally, the Russian export HRC and CRC prices were up 10%, respectively.
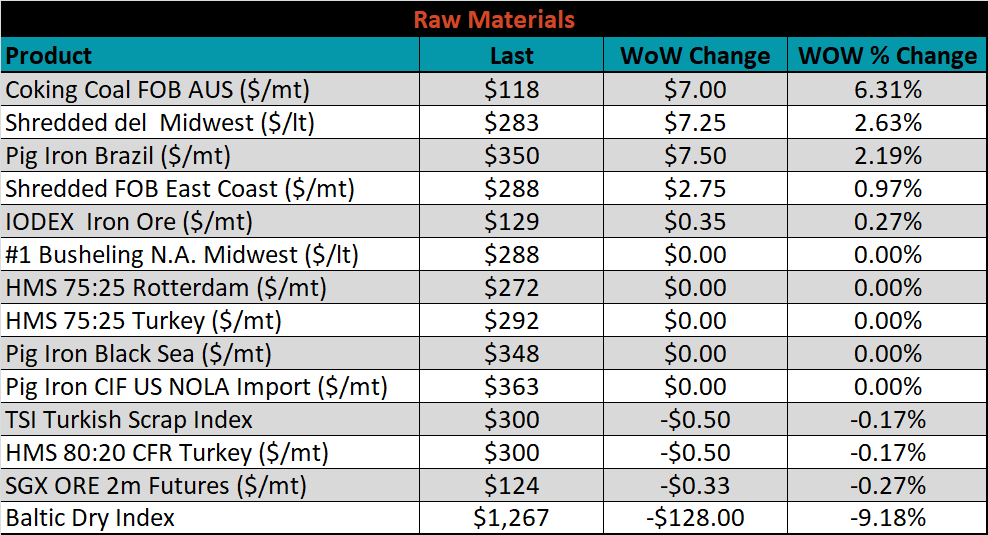
Raw material prices were mostly higher. Aussie coking coal was up 6.3%, while the Baltic Dry index was down another 9.2%.
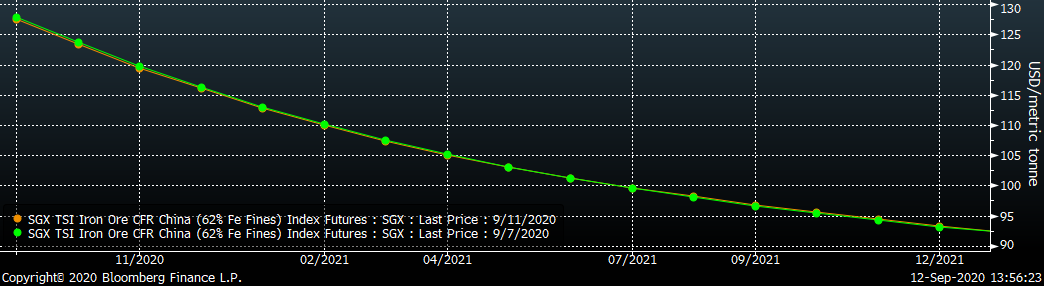
Below is the iron ore future curve with Friday’s settlements in orange, and the prior week’s settlements in green. Last week, the curve did not change.
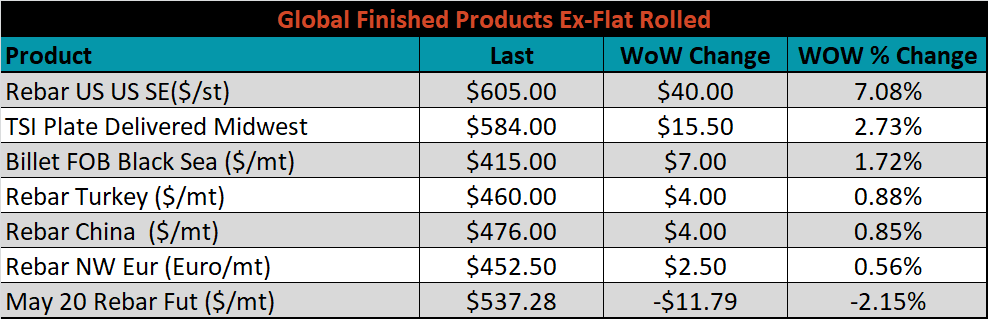
The ex-flat rolled prices are listed below.

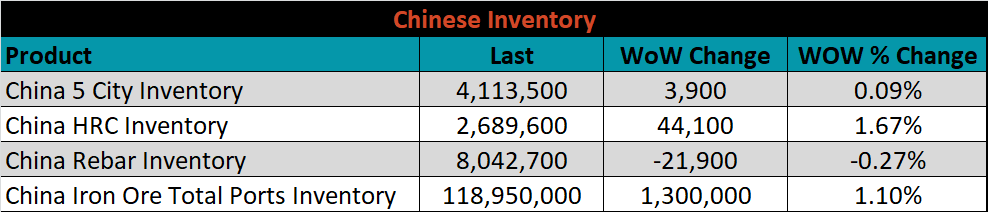
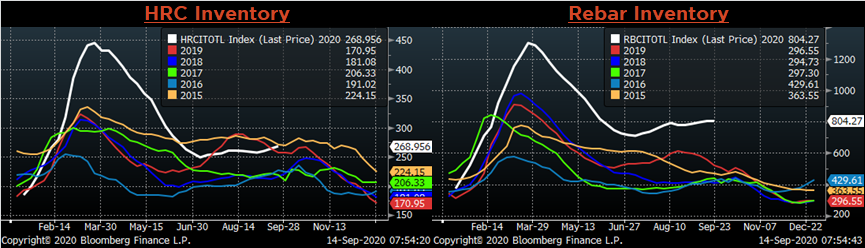
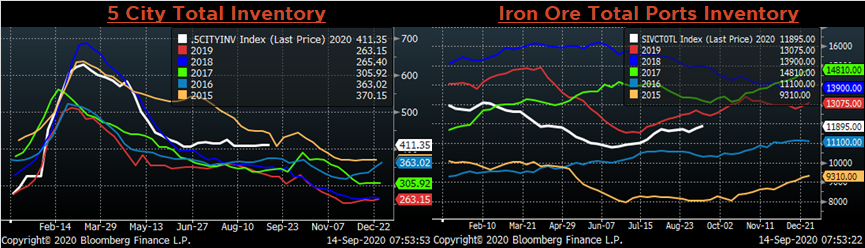
Below are inventory levels for Chinese finished steel products and iron ore. Last week, the HRC and Iron Ore inventory levels increased, while 5-city inventory was flat and Rebar was slightly lower. The HRC inventory level is just below its highest seasonal level in the past six years.
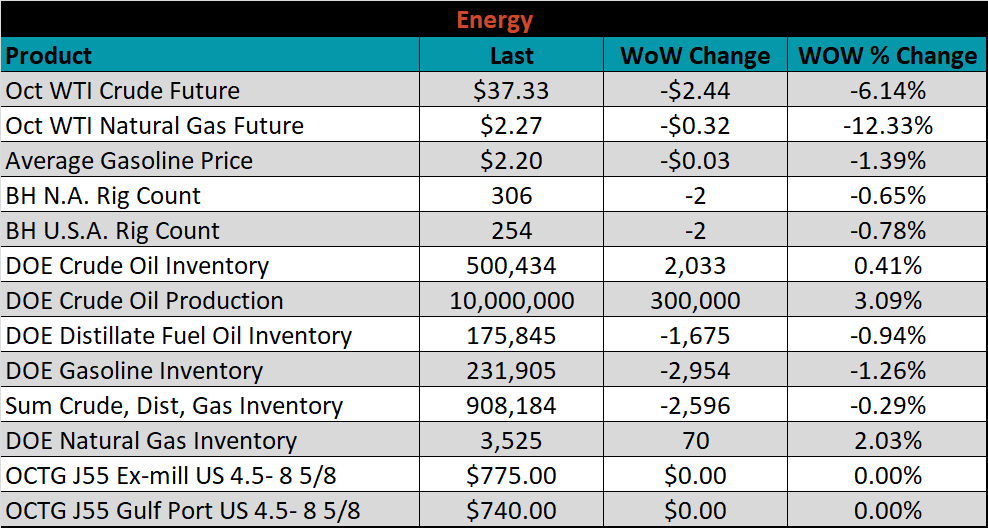
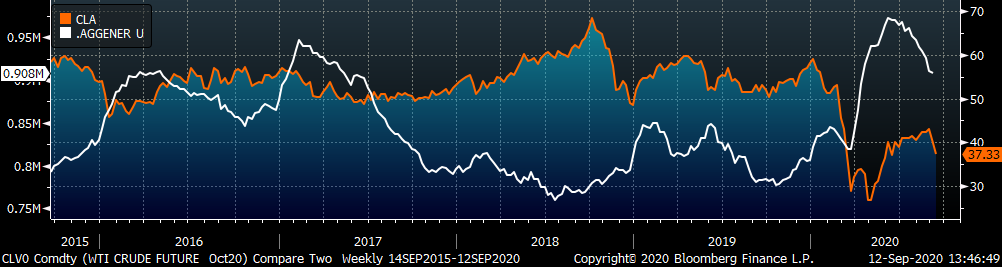
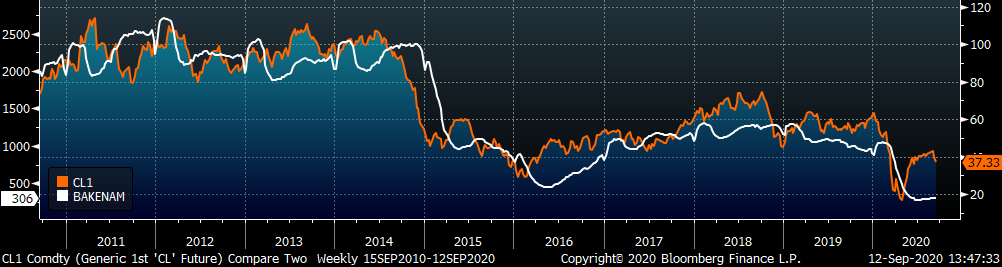
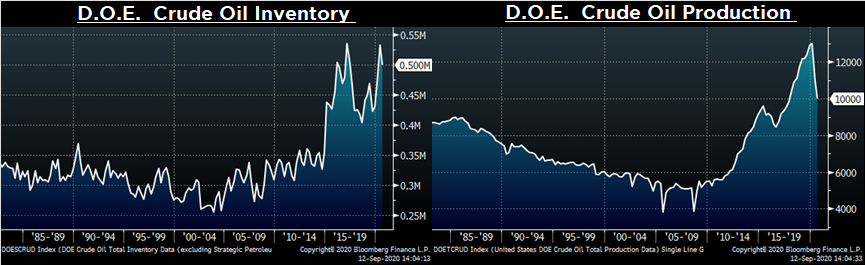
Last week, the October WTI crude oil future lost another $2.44 or 6.1% to $37.33/bbl. The aggregate inventory level was down another 0.3%, while crude oil production rose to 10m bbl/day. The Baker Hughes North American and U.S. rig count were both down two rigs.
The list below details some upside and downside risks relevant to the steel industry. The orange ones are occurring or look to be highly likely. The upside risks look to be in control.
Upside Risks:
Downside Risks:


