Content
-
Weekly Highlights
- Market Commentary
- Durable Goods
- Risks


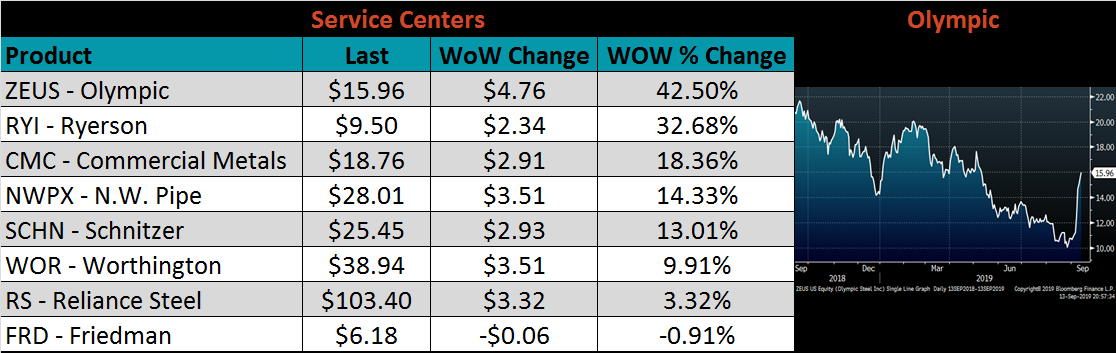
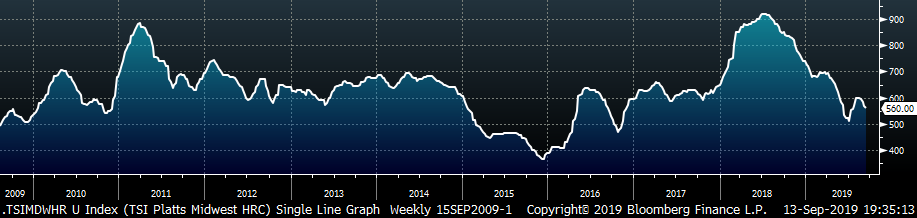
As the sentiment in the domestic HRC market has deteriorated recently with downside risks growing, we want to understand where the bottom in pricing may be so that we can understand the risk and rewards in our inventory and business. We will do this using the historical relationships between domestic HRC prices and the China HRC price, scrap pricing, and mill profitability.
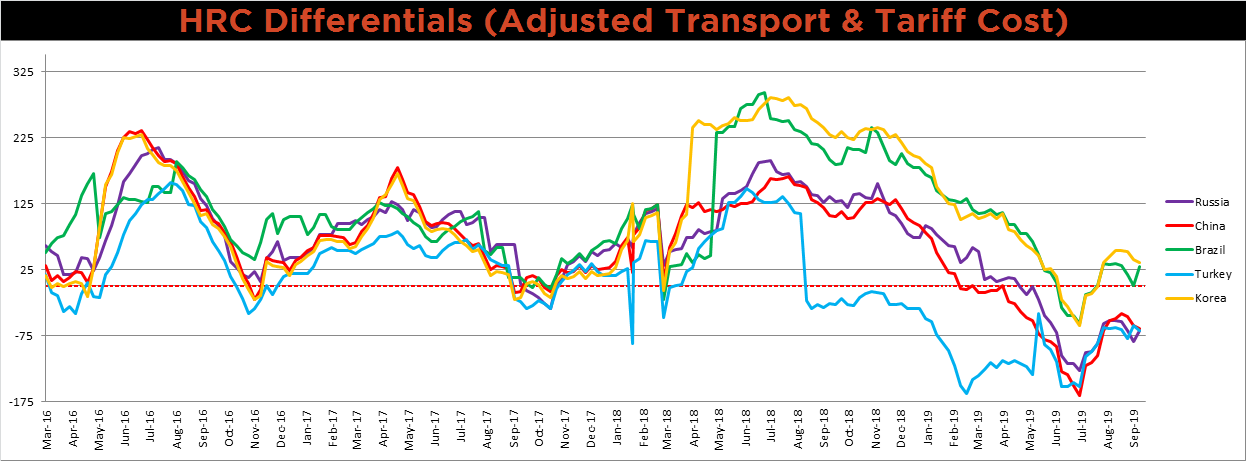
Due to China’s significant size within the global steel market, we tend to focus on the China export price, as it drives changes in the world HRC price. Back at the beginning of July when the domestic spot HRC price bottomed near $510/st, the differential between the US price and the China export price also bottomed. The chart below shows the differential, which is the difference between the Midwest HRC price and the China export price, including transportation costs.
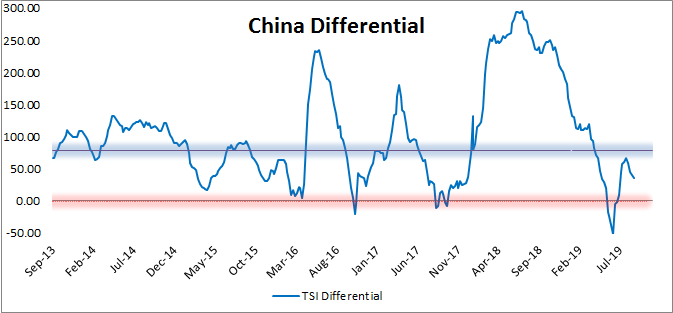
Currently, the China export price is $40/st lower than it was at the beginning of July. With this differential currently sitting near $35/st, we believe if this differential returns to the negative $50/st level of July, the new bottom in domestic HRC price is near $470/st.
Another market that reached a low point in late June was the domestic scrap market, with the #1 Busheling scrap price hitting its lowest levels of the year up to that point. The front month futures price hit $264 on June 21st before rallying through July and into August. However, this rally has faded and breached the previous low, and currently sits at $244.
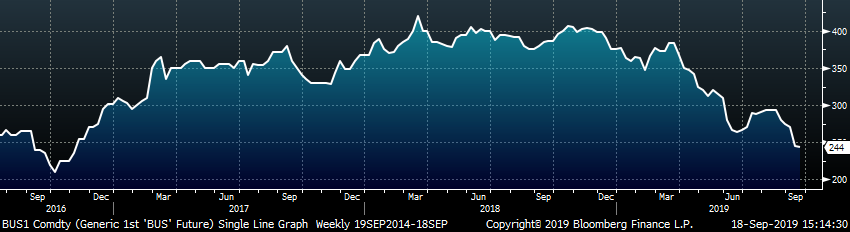
The current expectation for October scrap is down at least $20. Therefore, with the current price $20 below the low of the summer and an additional $20 drop expected, scrap pricing could be $40 below the June low when domestic HRC prices bottomed near $510/st. This also points to new bottom for HRC near the $470 level. Mill profitability has remained stable over the past several weeks as the current spot market still provides a solid margin over the mill’s cost. However, this also means that mills are able to withstand much lower spot pricing, and mini-mills cost advantage will lead them to fill order books over the next few months at lower prices.
Now is a good time to pick prices that look attractive for 2020, and be ready to lock them in should the market continue sliding lower.
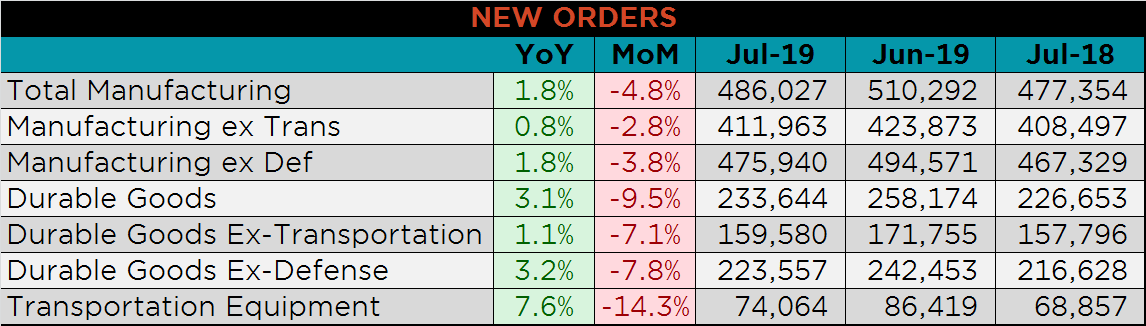
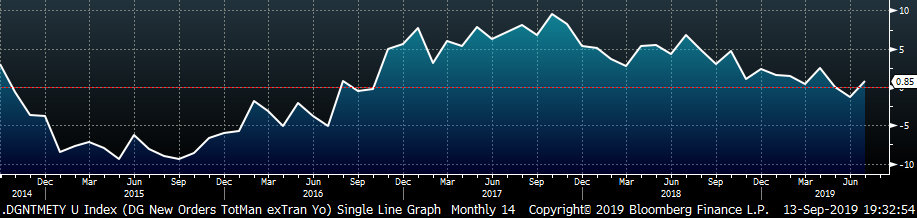
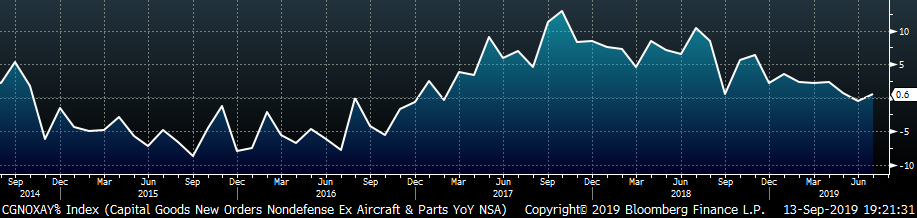
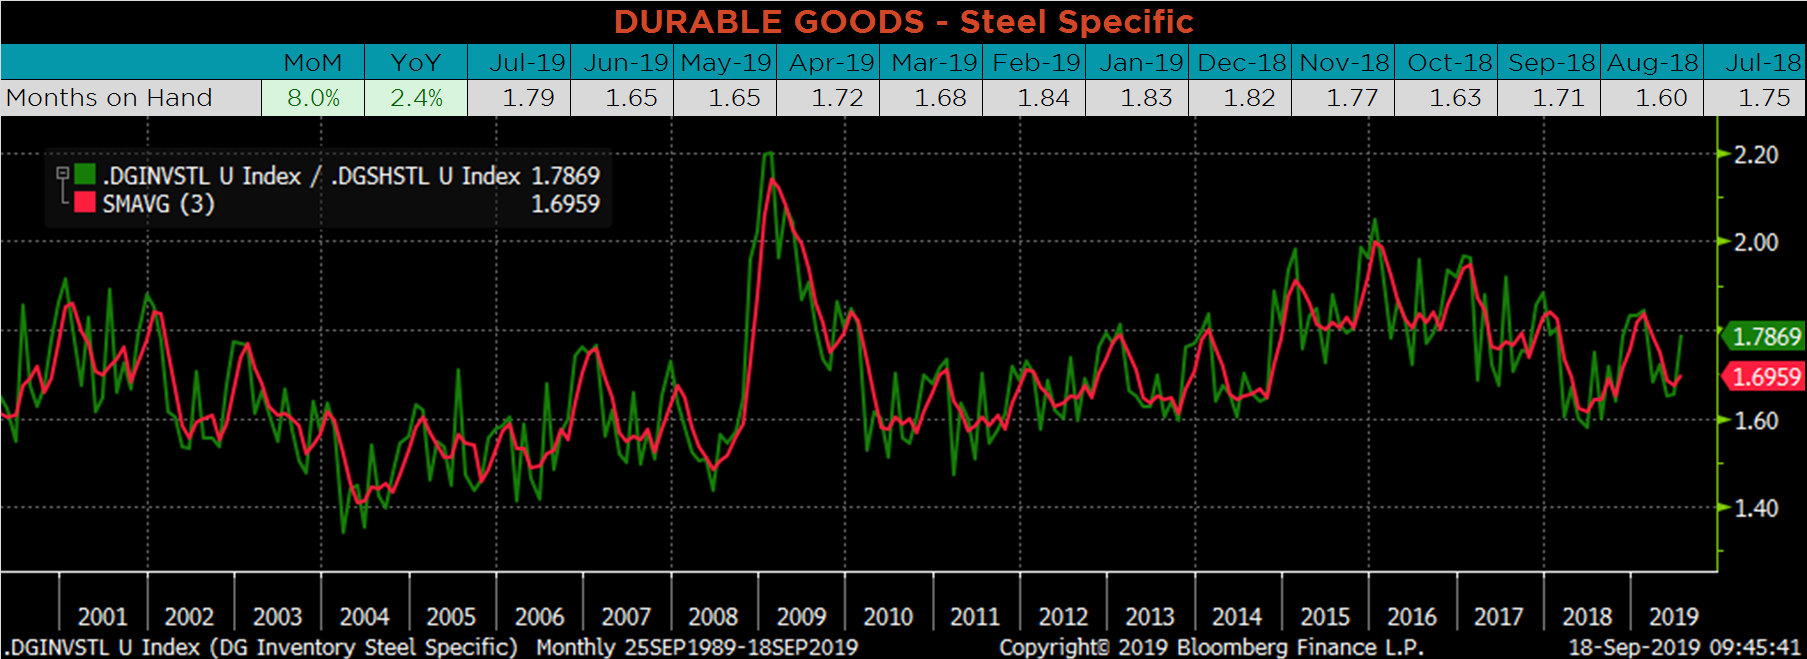
Below are final July new orders from the Durable Goods report. Overall, new orders were higher YoY, but lower than they were in June. This is due to normal seasonality, and the report points to a stabilization of the recent downtrend in new orders. The final chart looks at the months on hand (inventory divided by shipments) for durable goods categories that are steel intensive. Months on hand increased 8.0% since June, but this is likely due to stocking inventory in the midst of rising steel prices and improved outlook. We expect MOH to move lower in the August report.
Below are the most pertinent upside and downside price risks:
Upside Risks:
Downside Risks:
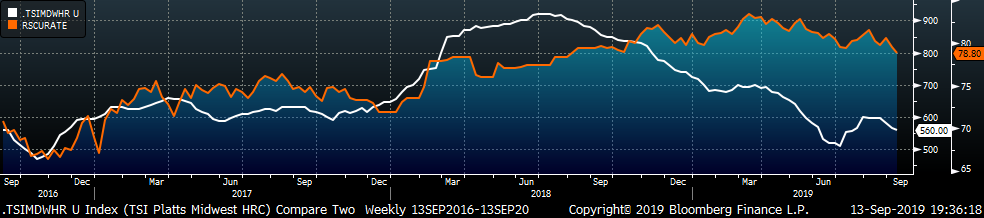
The Platts TSI Daily Midwest HRC Index was down $6.25 to $560.00.
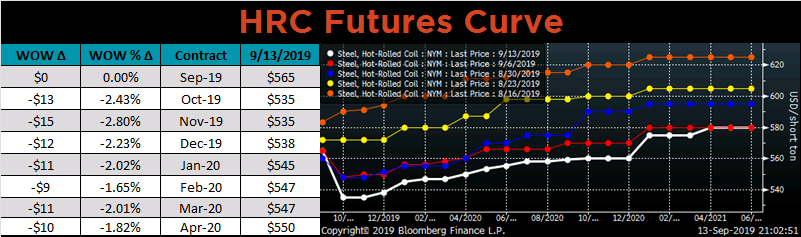
The CME Midwest HRC futures curve is below with last Friday’s settlements in white. The entire curve shifted lower on the week, reaching the lowest levels in the last 5 week.
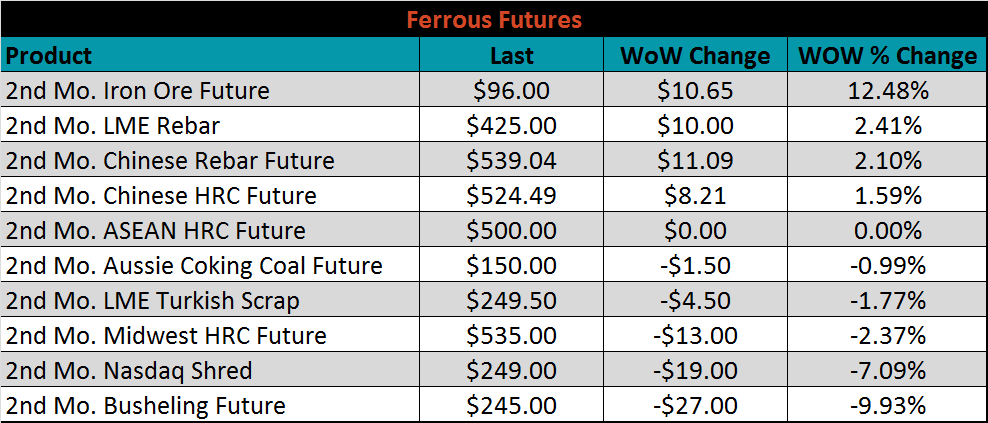
October ferrous futures were mixed. Iron ore futures gained 12.5%, while busheling lost 9.9%.
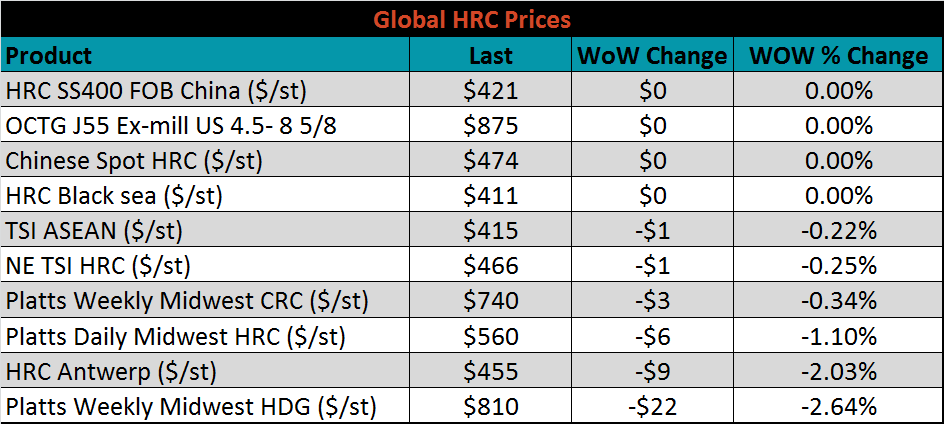
The global flat rolled indexes were all lower. Midwest HDG was down the most, at 2.6%.
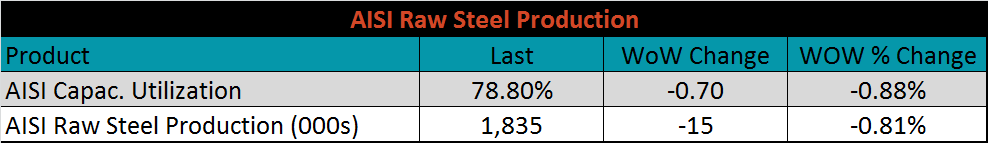
The AISI Capacity Utilization Rate was down 0.7% to 78.8%, and fell further below the 80% goal set by the Trump administration last October. This is the lowest utilization rate since August 2018, and upcoming planned outages suggest that raw steel production will continue to decline.
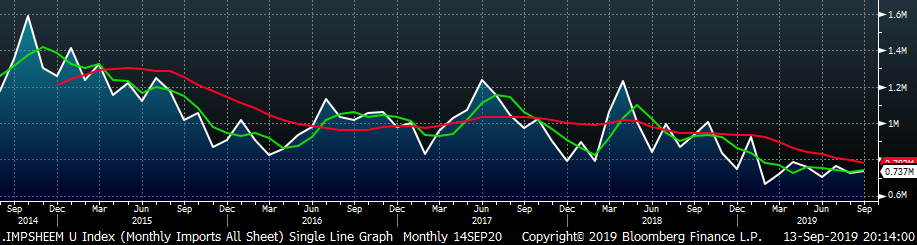
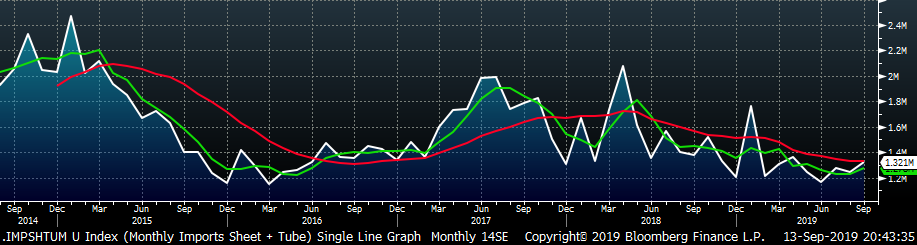
September flat rolled import license data is forecasting a small increase of 12k to 737k MoM.
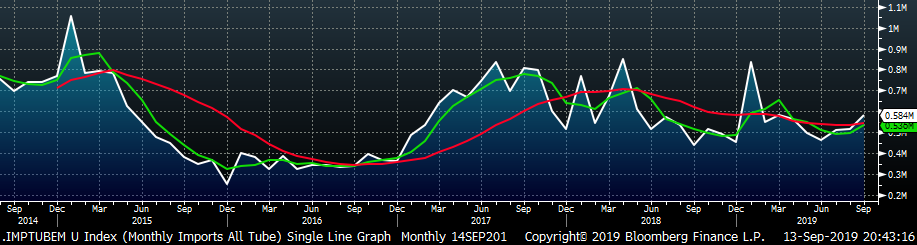
Tube imports license data is forecasting a MoM increase of 92k to 584k tons in September.
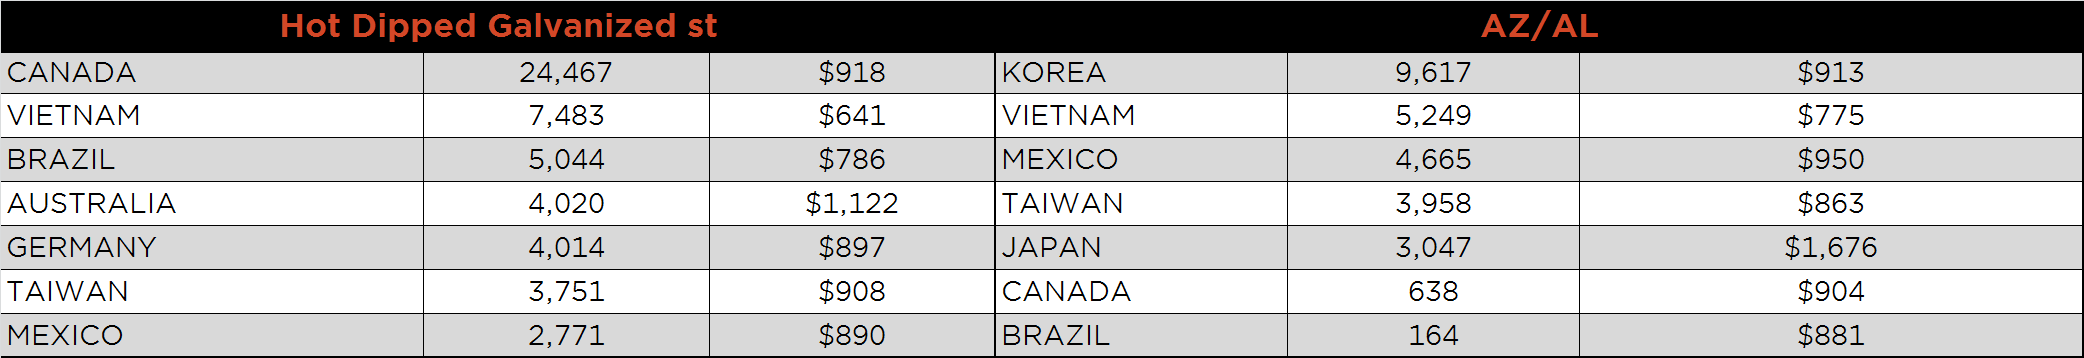
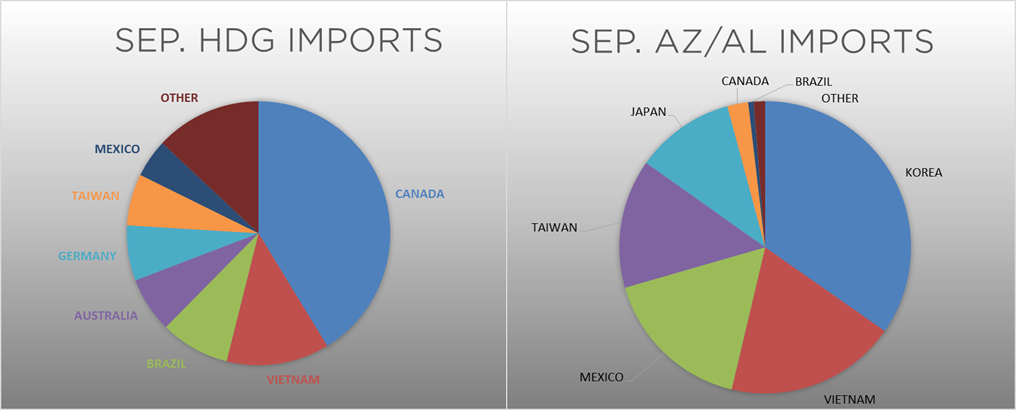
AZ/AL import license data is forecasting an increase of 49k in September to 110k.
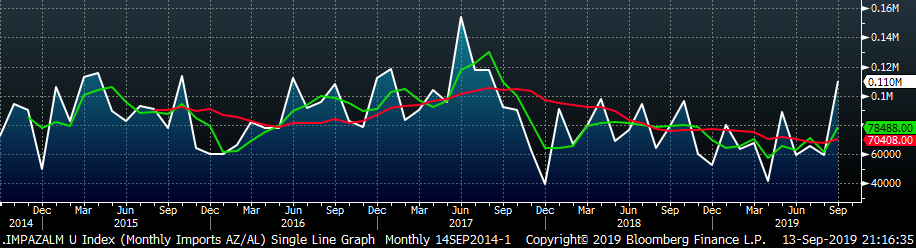
Below is August import license data through September 10, 2019.
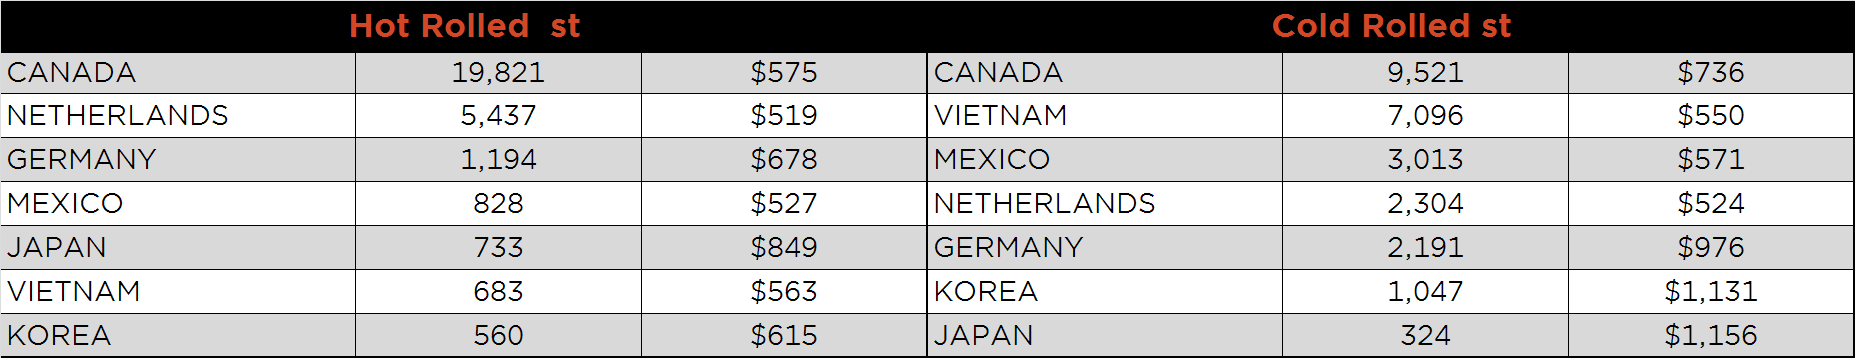
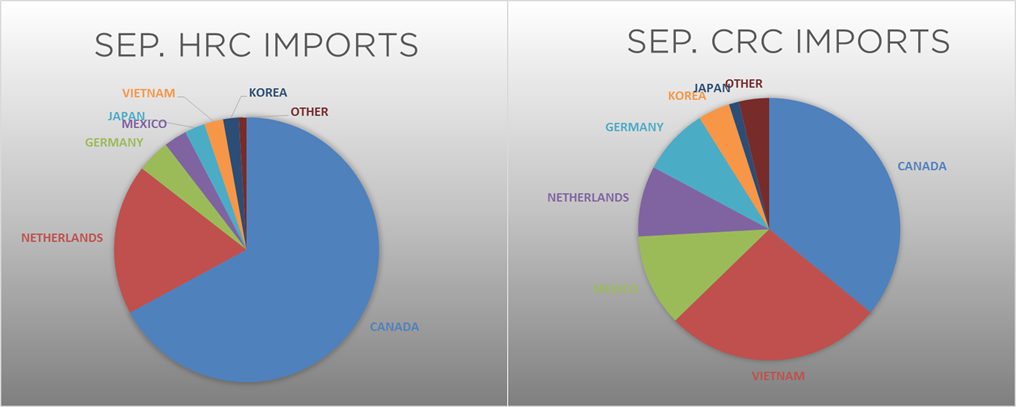
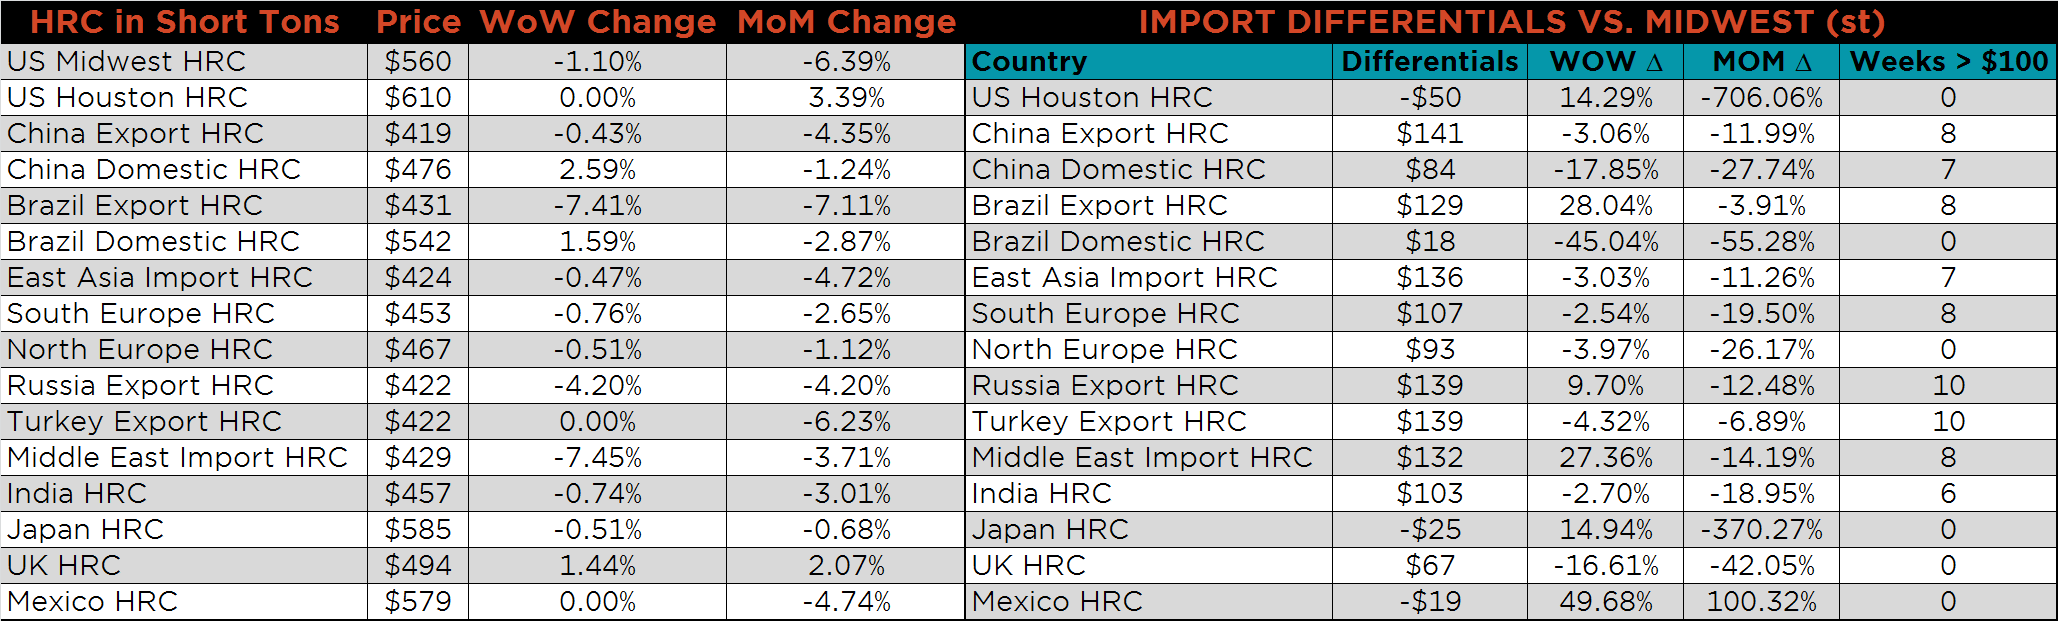
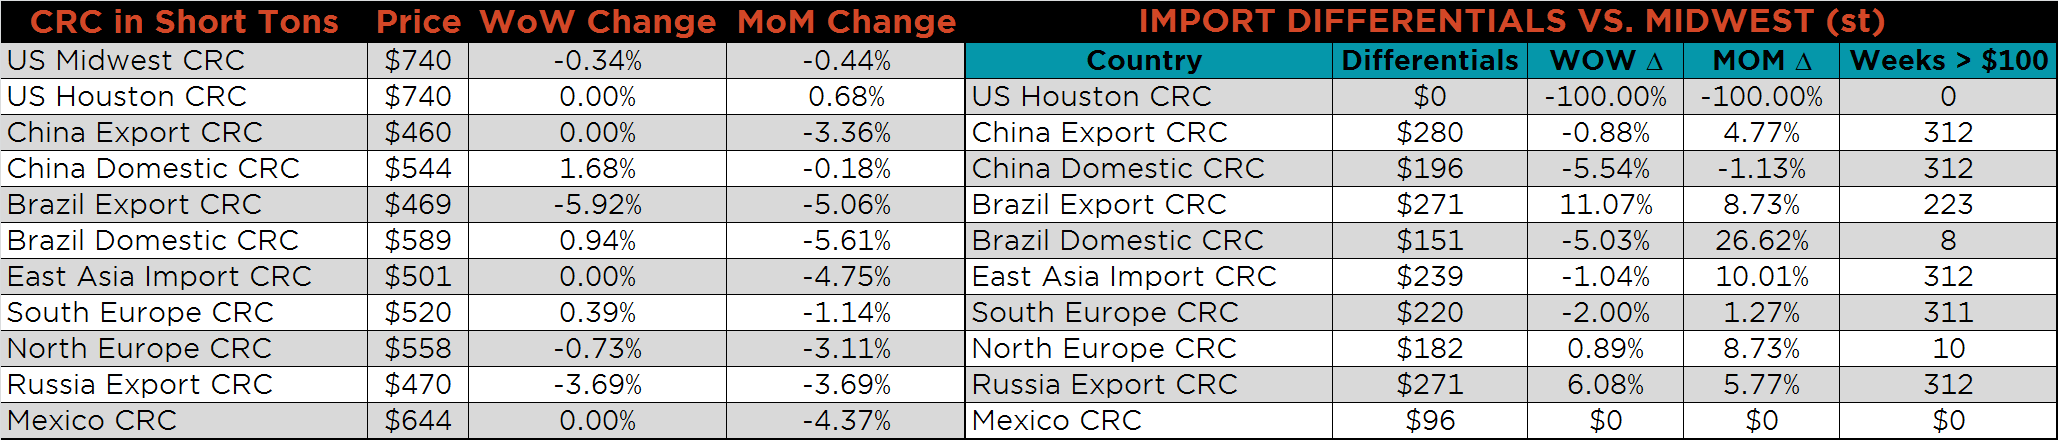
Below is the Midwest HRC price vs. each listed country’s export price using pricing from SBB Platts. We have adjusted each export price to include any tariff or transportation cost to get a comparable delivered price. Brazilian and Russian differentials were higher, while the remaining global differentials continued lower.
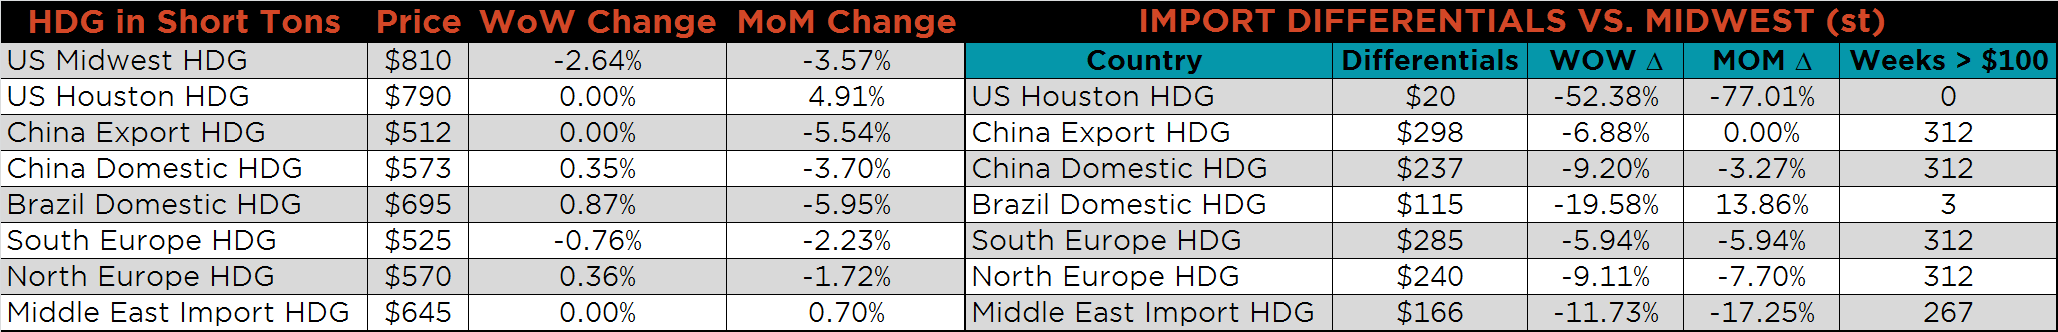
SBB Platt’s HRC, CRC and HDG pricing is below. The Midwest HDG, HRC and CRC prices were down on the week 2.6%, 1.1% and 0.3%, respectively. The Brazilian HRC and CRC export prices were lower, 7.4% and 5.9% respectively, while the Russian HRC export price was down 4.2%.
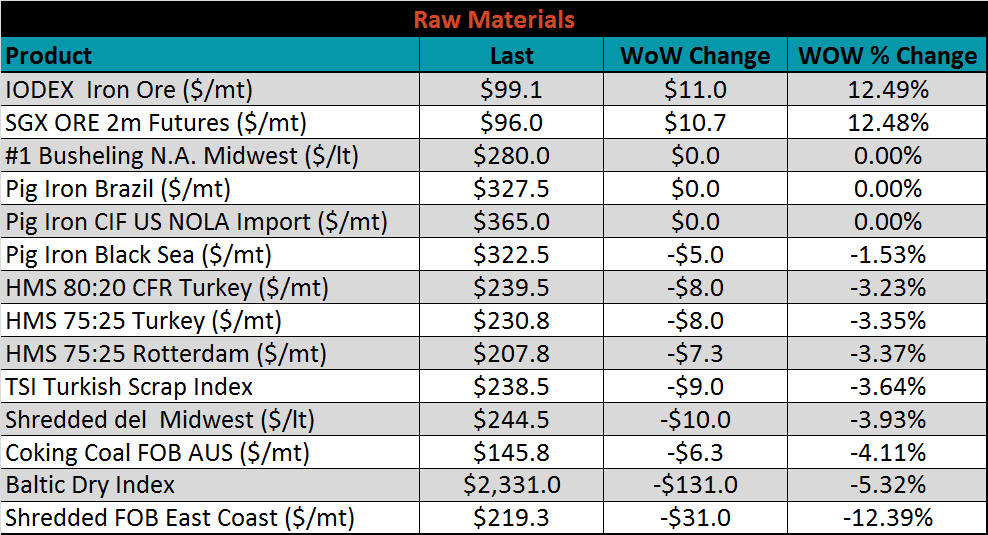
Raw material prices were mixed. The IODEX and SGX iron ore futures were each up 12.5%, while shredded FOB East Coast was down 12.4%.
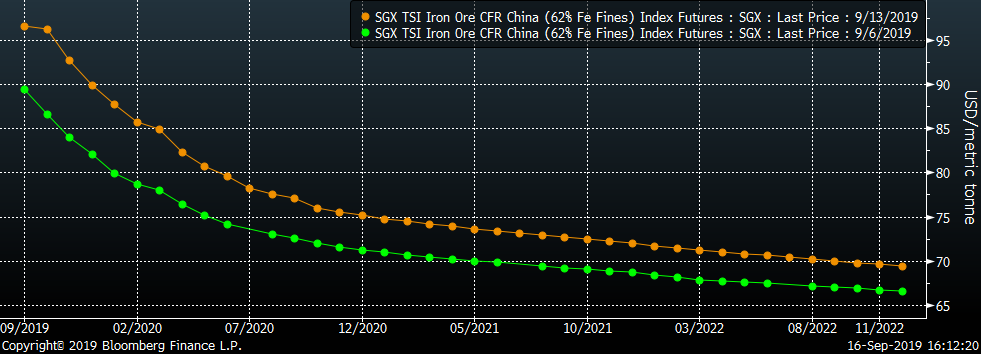
Below is the iron ore future curve with Friday’s settlments in orange, and the prior week’s settlements in green; the entire curve shifted higher.
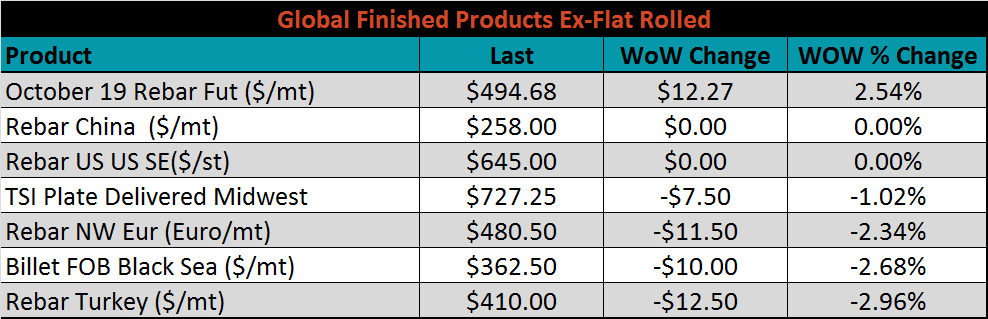
The ex-flat rolled prices are listed below.

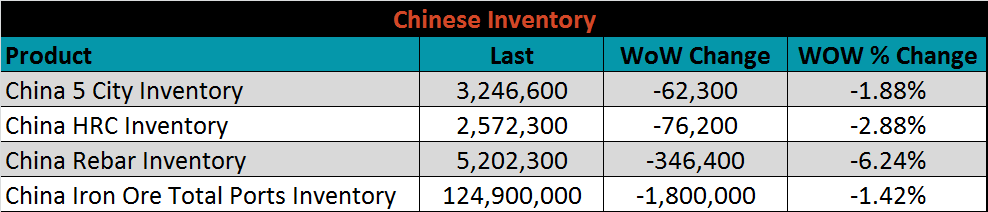
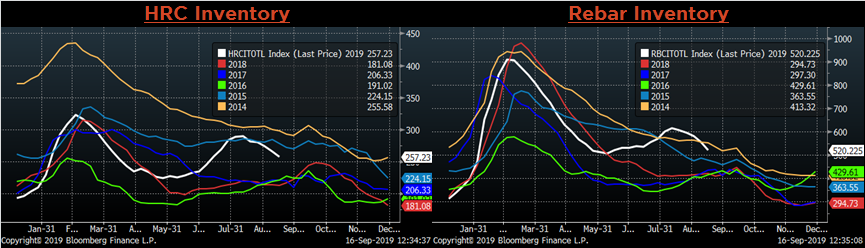
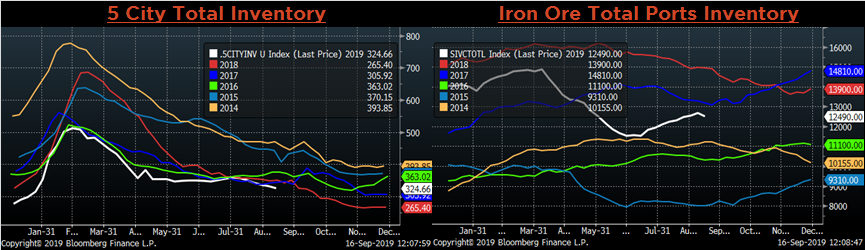
Below are inventory levels for Chinese finished steel products and iron ore. HRC, Rebar and 5-City inventory levels were lower again, while Iron Ore port inventory has continued to increase. Another month of poor manufacturing data suggests that the trend of destocking finished products will likely continue.
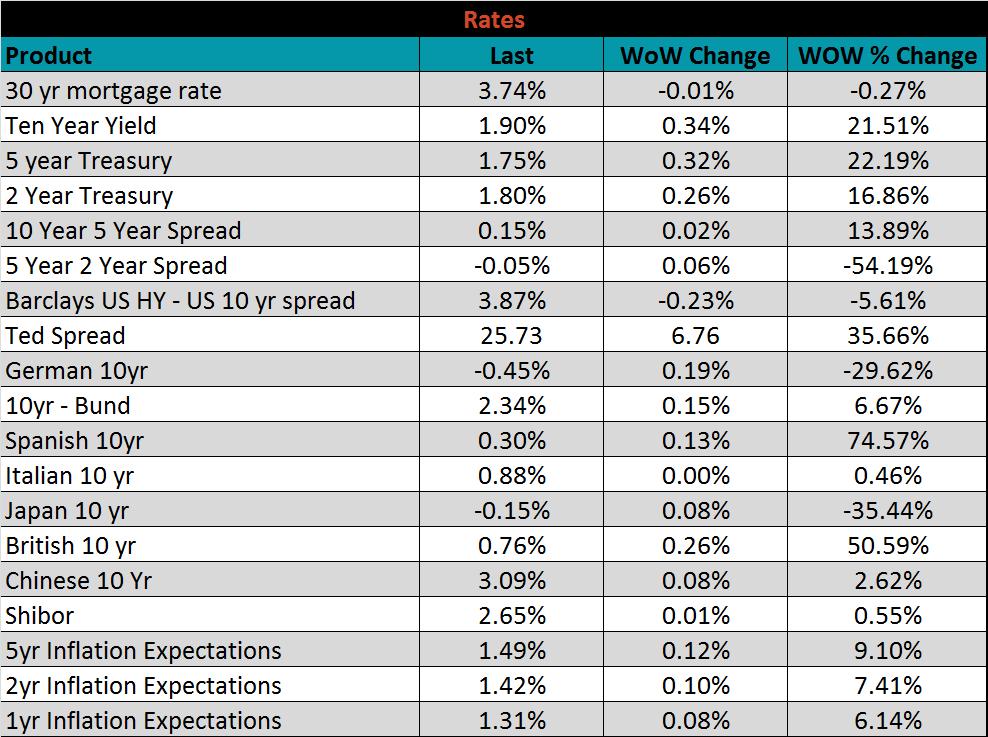
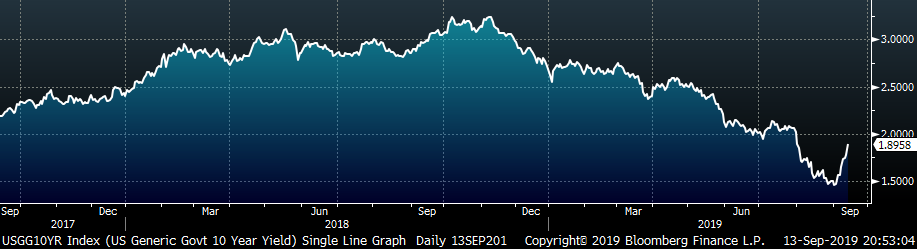
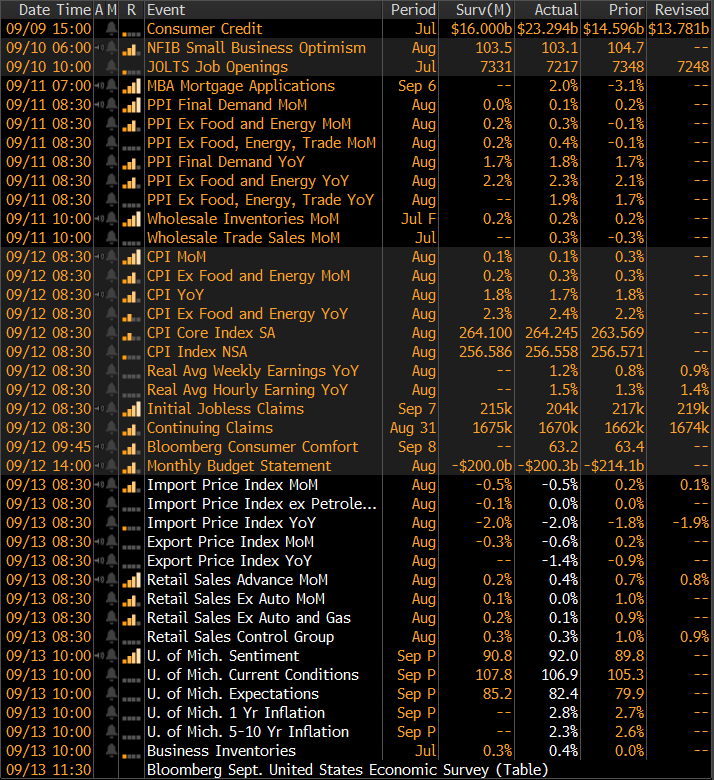
The remainder of the pertinent economic data is to the right. This week’s CPI printing suggests that inflation is within the target range. While a rate cut in the September is all but guaranteed, continued strength in inflation printings would suggest that the FED Funds Rate should remain flat, putting the FOMC in a difficult position as growth outlook deteriorates.
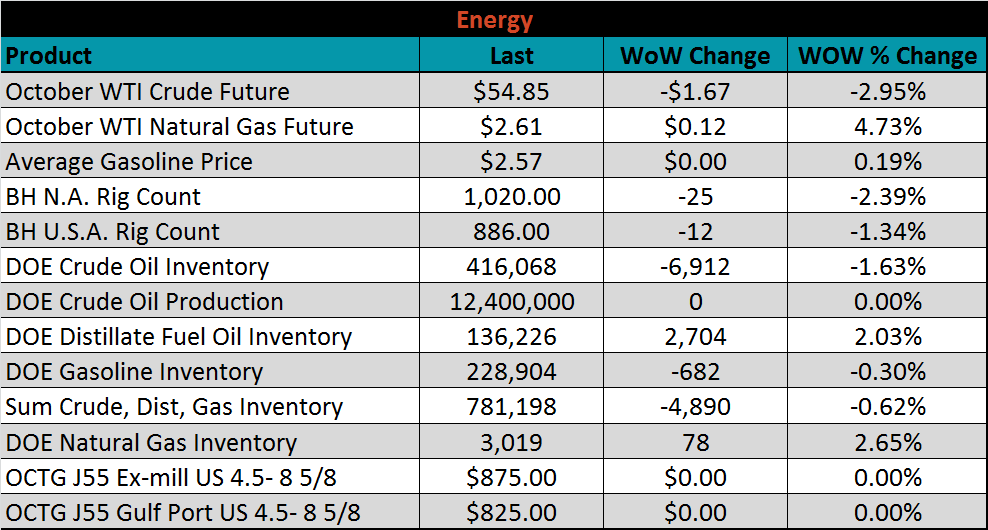
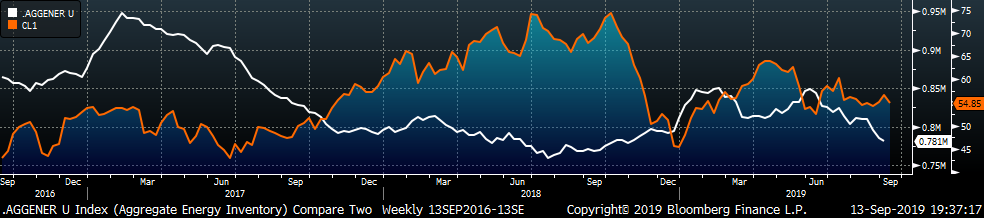
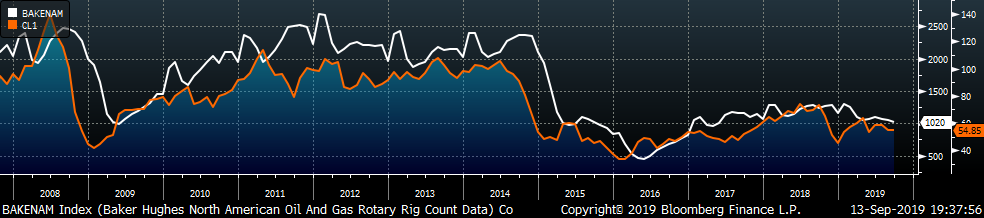
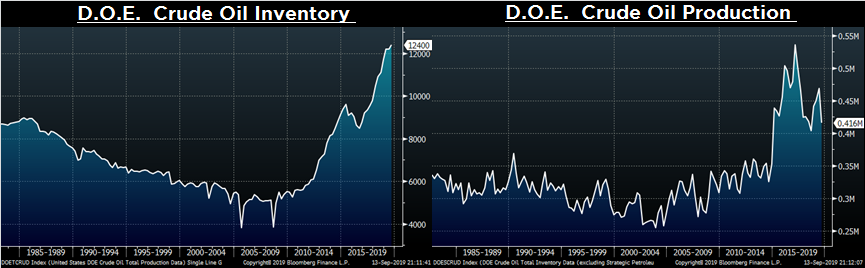
Last week, the October WTI crude oil future lost $1.67 or 3% to $54.85/bbl. The aggregate inventory level was 0.6% lower, and crude oil production was unchanged 12.4m bbl/day. The Baker Hughes North American rig count lost twenty-five rigs and the U.S. count lost twelve. Shockwaves were sent through the energy market after the weekend attack on Saudi Arabia’s oil production facilities, but implications appear subdued with production being restored quicker than expected.
The list below details some upside and downside risks relevant to the steel industry. The orange ones are occurring or look to be highly likely. The upside risks look to be in control.
Upside Risks:
Downside Risks: