Content
-
Weekly Highlights
- Market Commentary
- Upside & Downside Risks


The standoff between buyers and the mills continues another week as each side waits for the other to make their next move. After four straight weeks of HRC price consolidation around $1,950, the physical market still does not have any clear indication of where the spot price is headed. This holdout is important in and of itself because it is the first time since the rally began that the buy side has enough inventory to fill today’s downstream demand. Because of this, lead times have recently dipped to their lowest levels since late November 2020. In addition, we are seeing limited spot availability (offered at elevated market price) from some mills which have been sold out for over 6 months. While the drum beats louder every day for lower prices, it is important to remember that this “feeling” of an impending turnaround has yet to be supported by measurable data. Further, just because buyers are constantly predicting and hoping the price will collapse doesn’t mean it will. The fact is that at this point nothing in the physical market indicates a crash in prices is a likely outcome. While inventories have started to build, a deeper dive into the data shows that backlogs continue growing as well. This would suggest that while buyers currently have a buffer, they do not have enough leverage to wait it out through the end of the year.
However, as the standoff continues and downside pressure that will inevitably cause the rally to end continues to mount, it will be important stay ahead of these moves and to start thinking about support levels for a declining domestic market. What this means in practice is hedging your risk when there are opportunities to reduce your future cost or volatility. While we at FGM are constantly evaluating and promoting opportunities on the HRC futures curve, this can also look like buying imports at a fixed price. The fact of the matter is that no one knows where the spot price will be by the end of the year, much less in the 1st quarter. However, the spread between current spot prices and 1Q22 import offers is over $450. With less than 3 months to go until the start of 1Q22, the physical market would have to fall by an average of $100 per month for 6 straight months to be able to buy spot material at a lower price in the first quarter. For additional context, this would be a 30% collapse in 6 months and the only time prices fell that rapidly over that short of a period was in 2008. Other than 2008, the closest scenario comes in 2016 where the price fell just under 30% in nearly 5 months only to be immediately followed by a 40% rally over the next 6 months. Additionally, it is important to keep in mind what is different between those times and now:
In the coming weeks, we anticipate insight into the 2022 domestic market as more mill contracts come to light, preliminary reports suggest that they will be significantly more favorable for mills compared to recent years. We doubt that spot prices will fall before the mills finalize their 2022 contracts, but lower prices may be in store for 2022. The question for buyers right now is: Are you willing to gamble on a crisis era prices crash, or should you provide certainty to your business by locking in attractive, discounted prices for next year?
Below are the most pertinent upside and downside price risks:
Upside Risks:
Downside Risks:
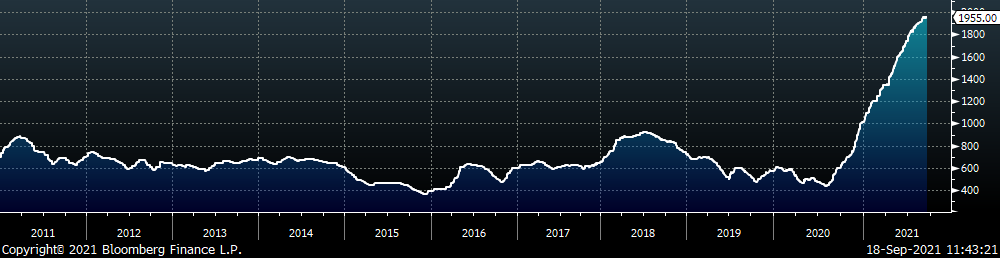
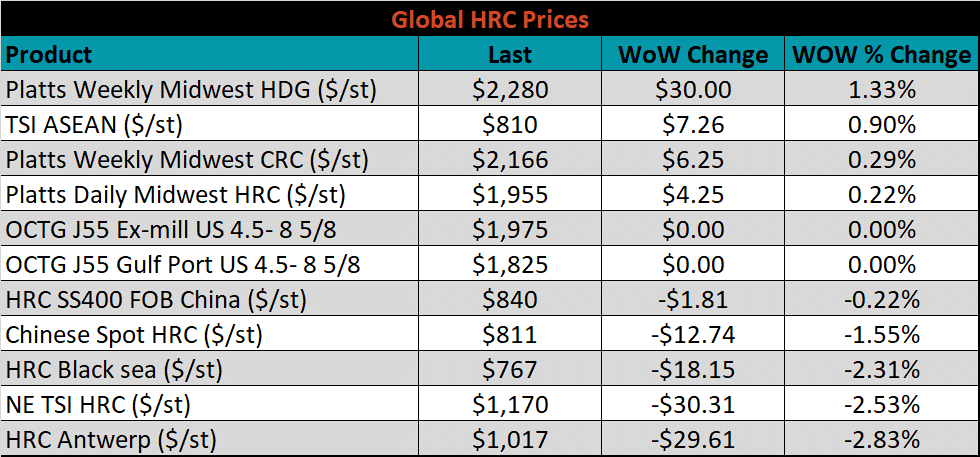
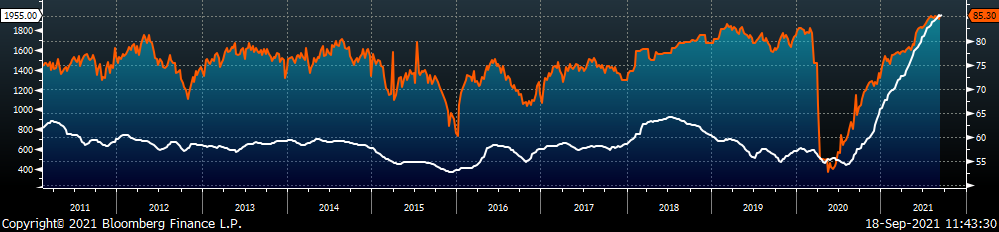
The Platts TSI Daily Midwest HRC Index increased by $4.25 to $1,955.
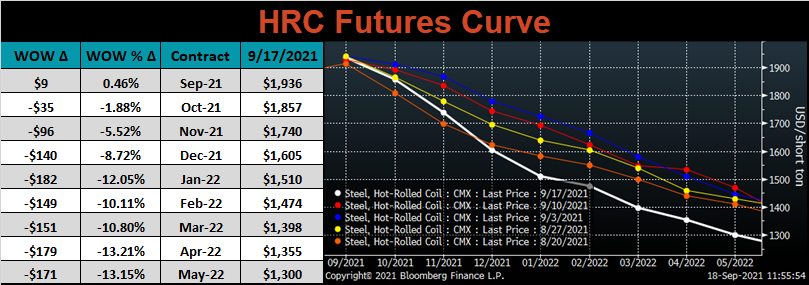
The CME Midwest HRC futures curve is below with last Friday’s settlements in white. The futures continued to sell off dramatically at all expirations throughout the week, most significantly in 2022.
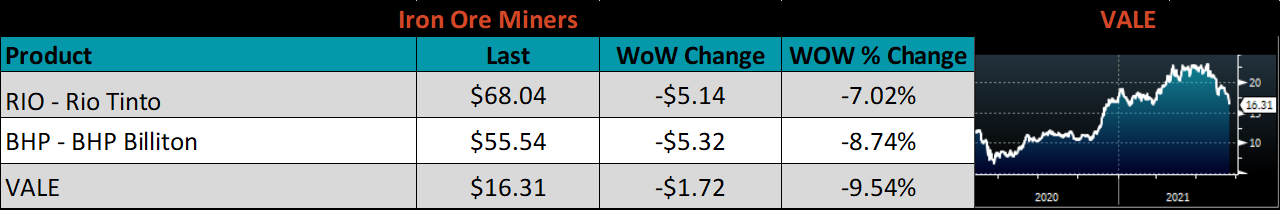
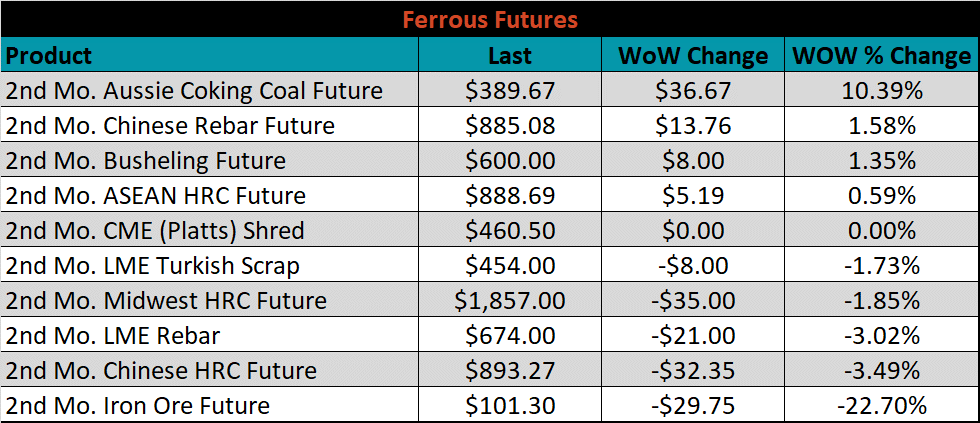
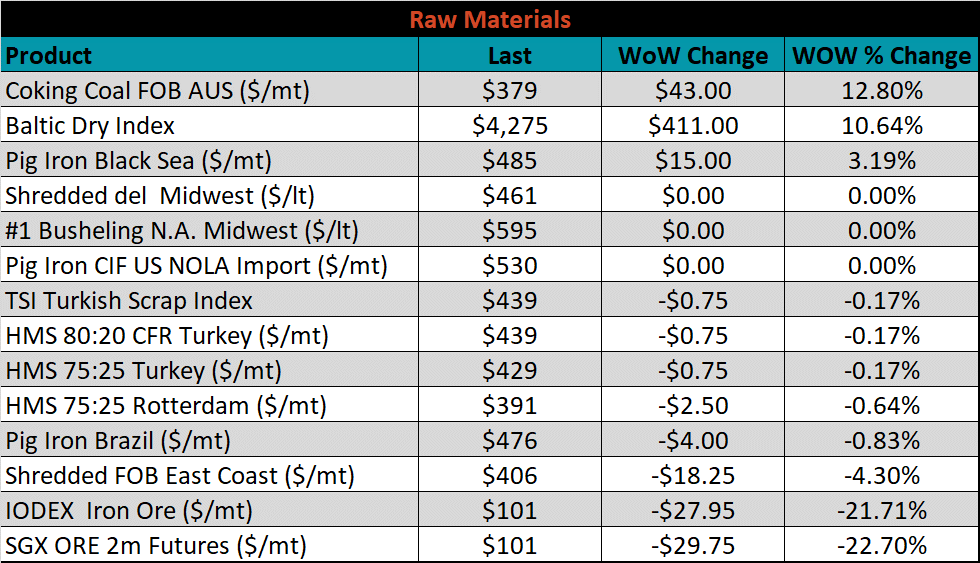
October ferrous futures were mixed, with Aussie coking coal up another 10.4%, while iron ore lost another 22.7%.
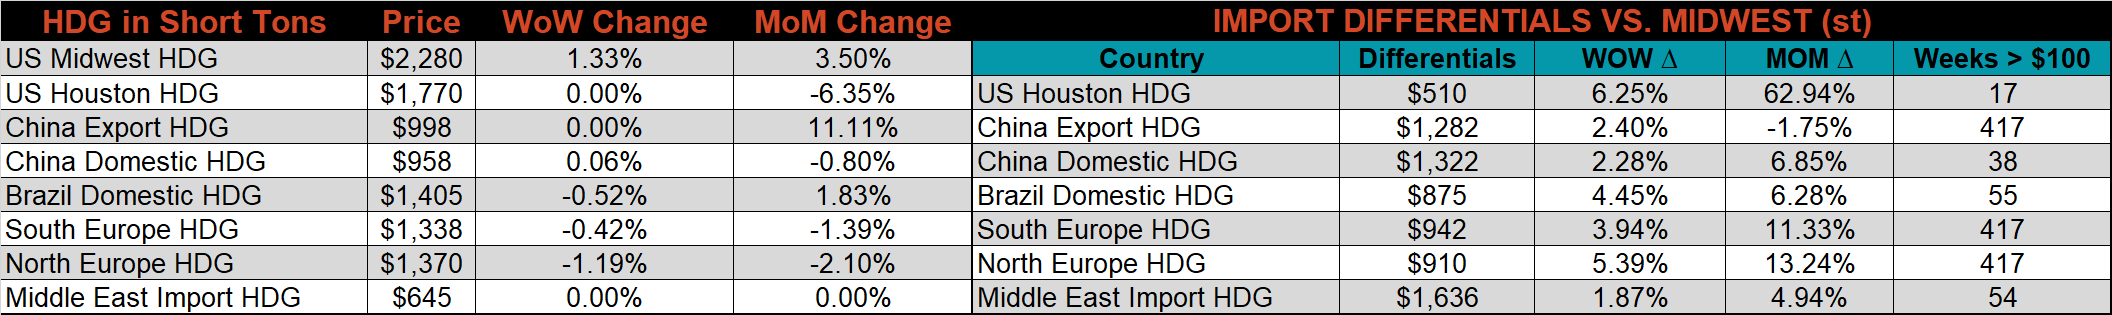
Global flat rolled indexes were mixed. The Platts Midwest HDG price was up 1.3%, while HRC Antwerp was down 2.8%.
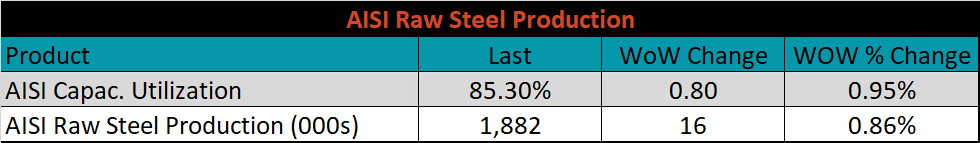
The AISI Capacity Utilization rate jumped 0.8% to 85.3%.
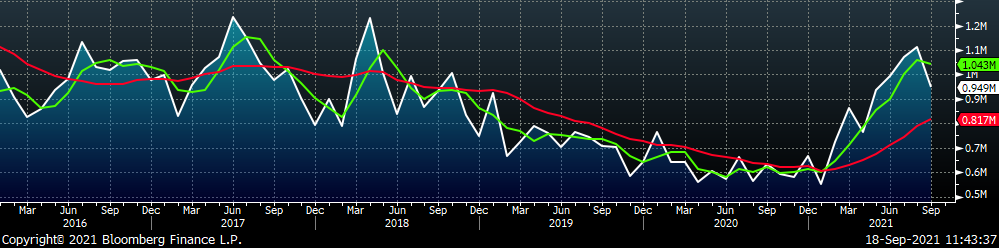
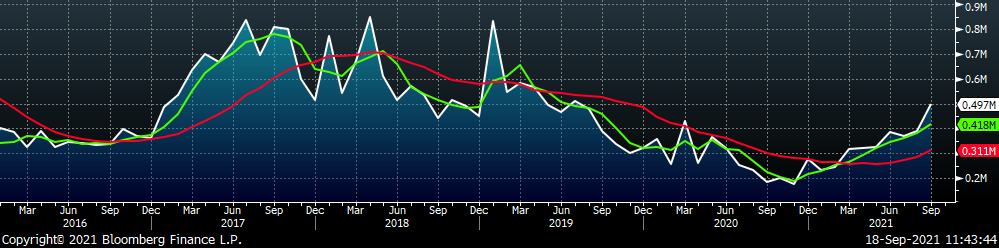
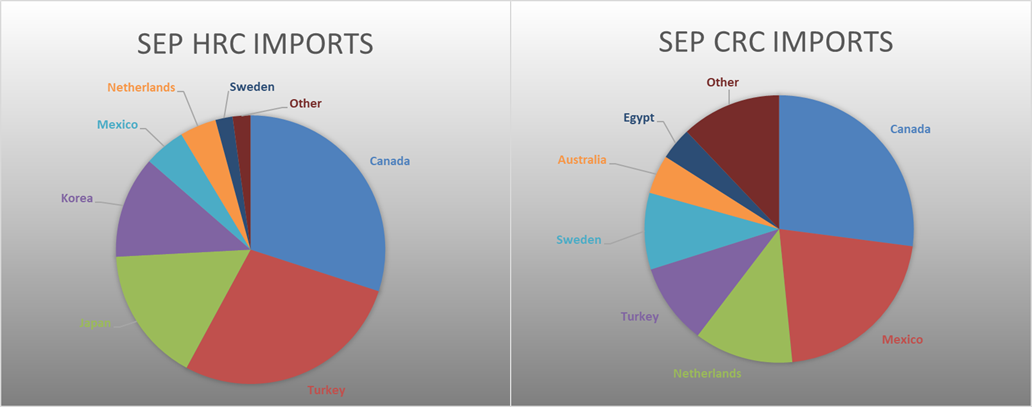
September flat rolled import license data is forecasting a decrease of 162k to 949k MoM.
Tube imports license data is forecasting an increase of 109k to 497k in September.
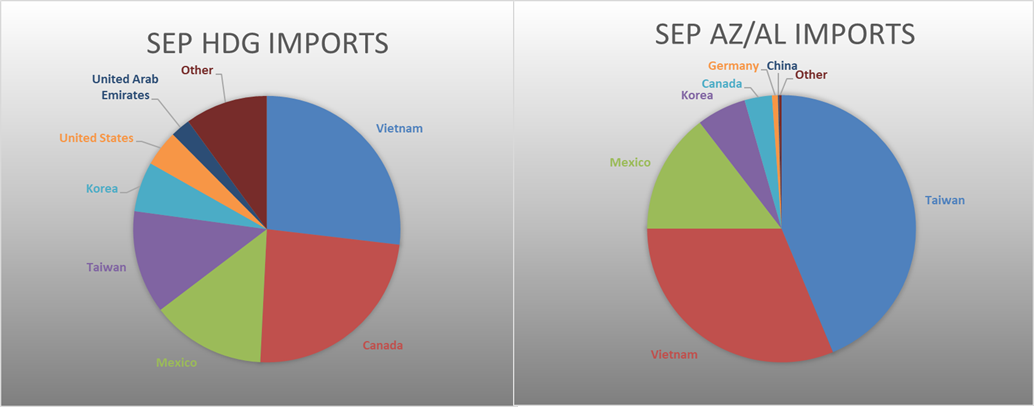
September AZ/AL import license data is forecasting a decrease of 6k to 107k.
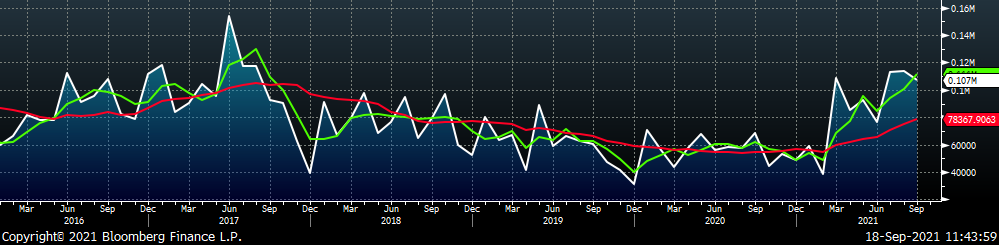
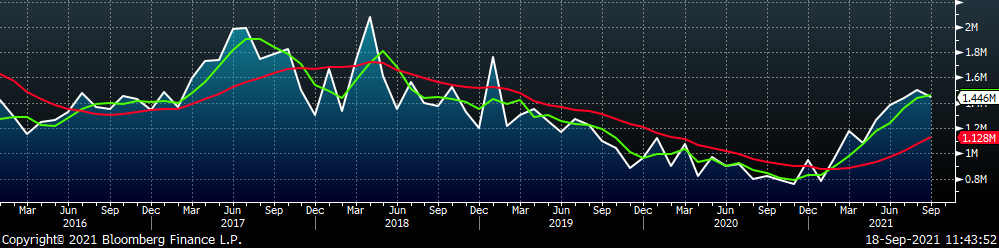
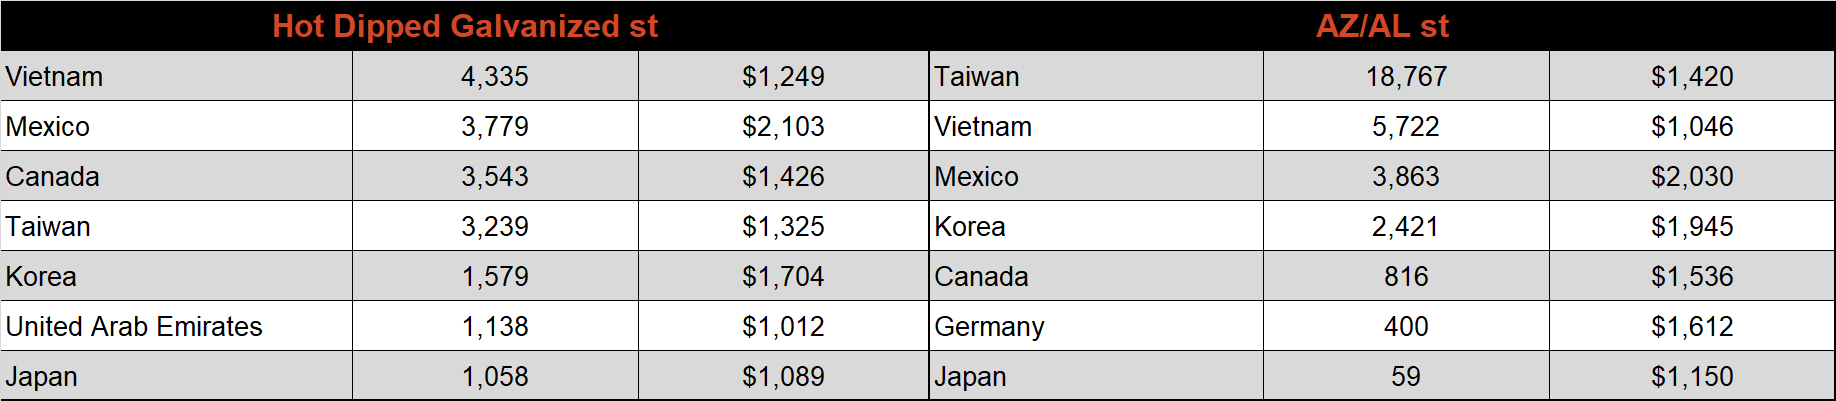
Below is September import license data through September 13th, 2021.
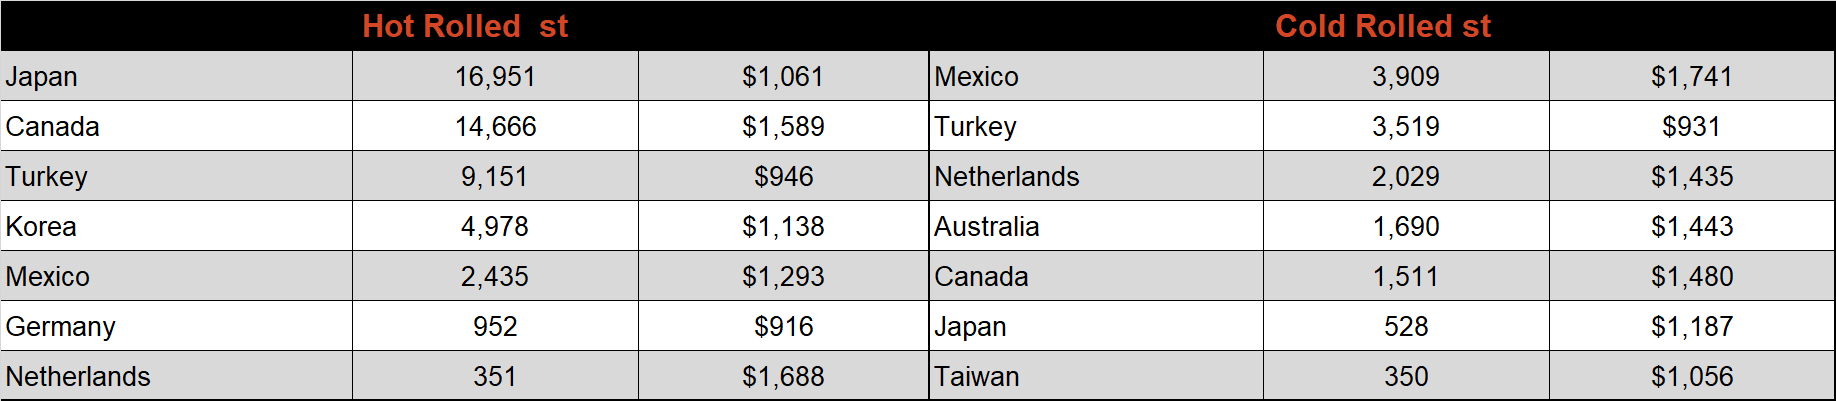
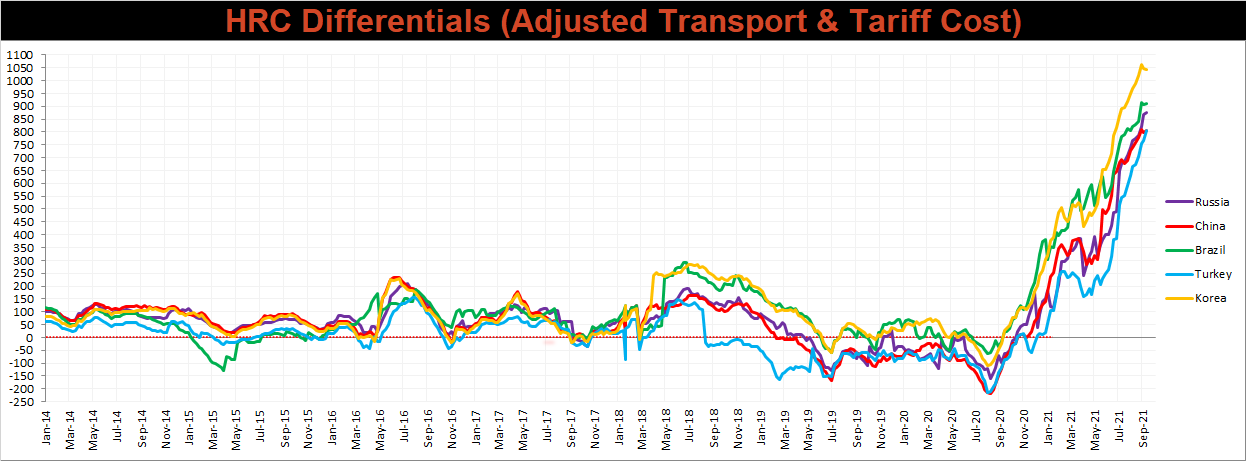
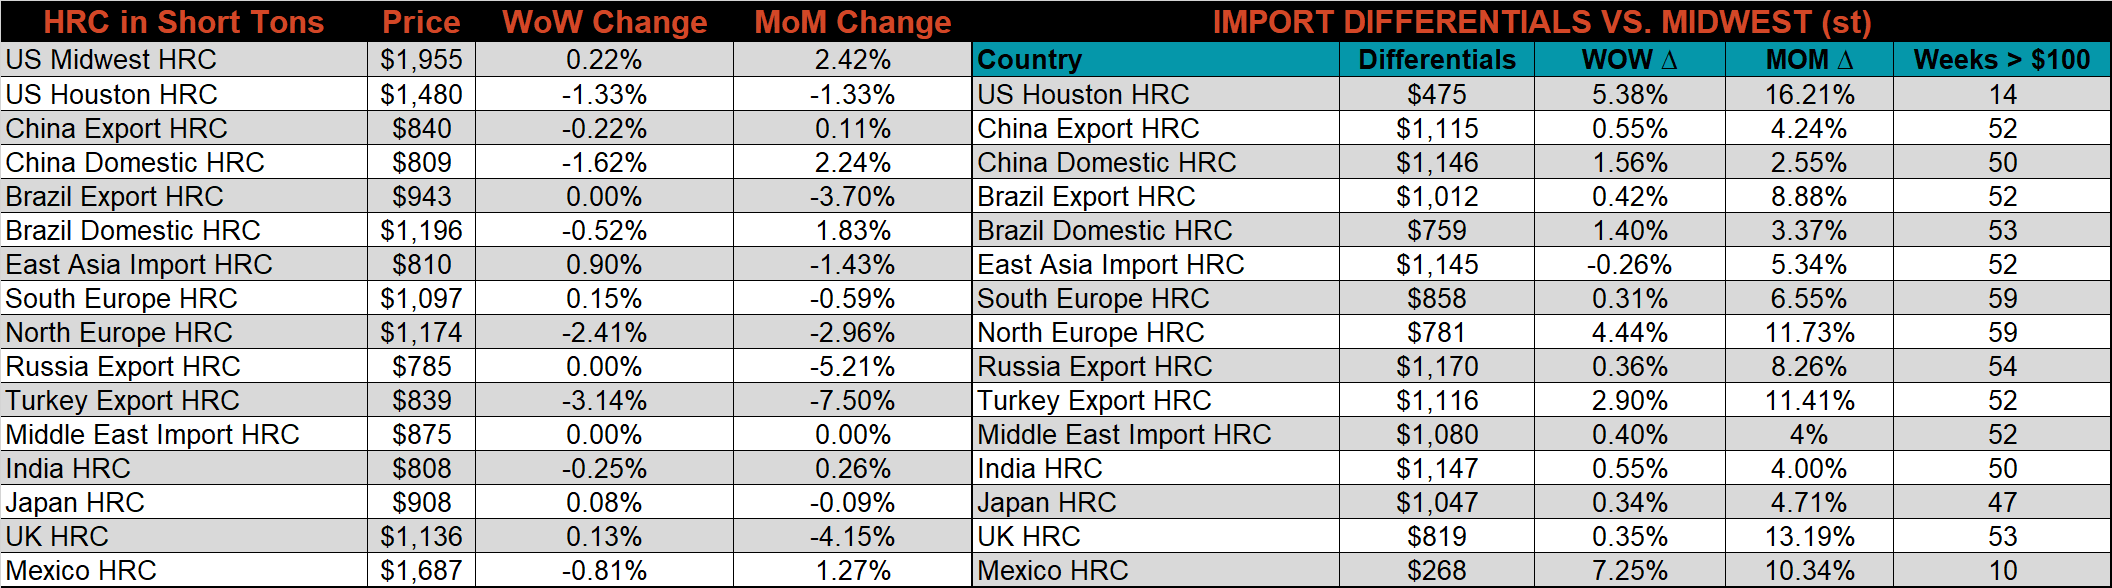
Below is the Midwest HRC price vs. each listed country’s export price using pricing from SBB Platts. We have adjusted each export price to include any tariff or transportation cost to get a comparable delivered price. Differentials increased slightly for all of the watched countries prices other than Korea, as global prices were mainly lower, and the U.S. domestic price ticked 0.2% higher.
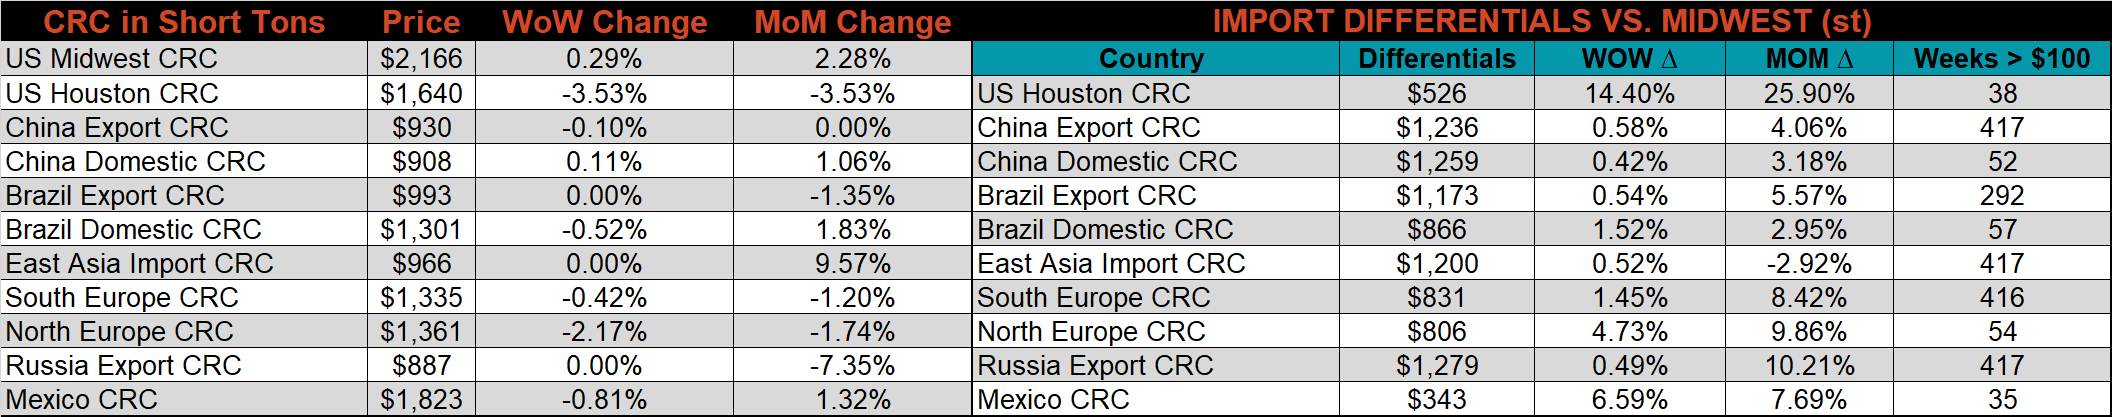
SBB Platt’s HRC, CRC and HDG pricing is below. The Midwest HDG, CRC, & HRC prices were up by 1.3%, 0.3%, and 0.2%, respectively. Outside of the U.S., the Turkish HRC export price was down 3.1%.
Raw material prices were mostly lower, led by iron ore futures, down another 22.7%, while Aussie coking coal gained another 12.8%.
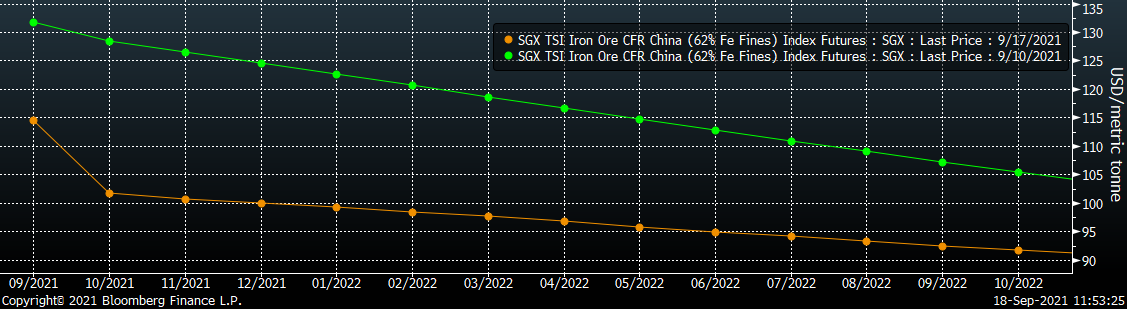
Below is the iron ore future curve with Friday’s settlements in orange, and the prior week’s settlements in green. Last week, the entire curve continued its recent trend and shifted significantly lower, esspecially in the front months, with the curve flattening in the back.
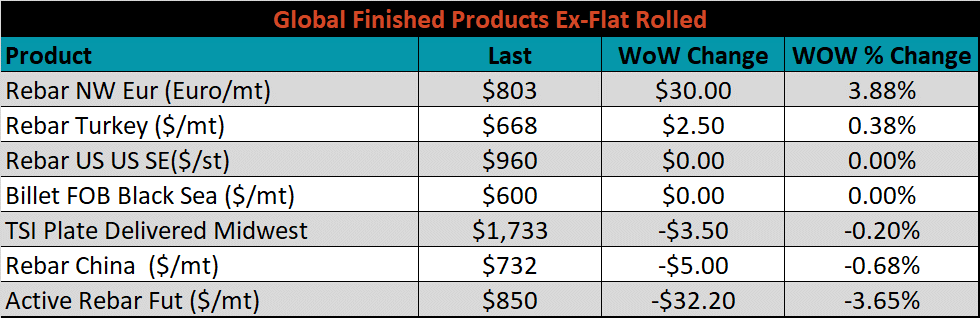
The ex-flat rolled prices are listed below.

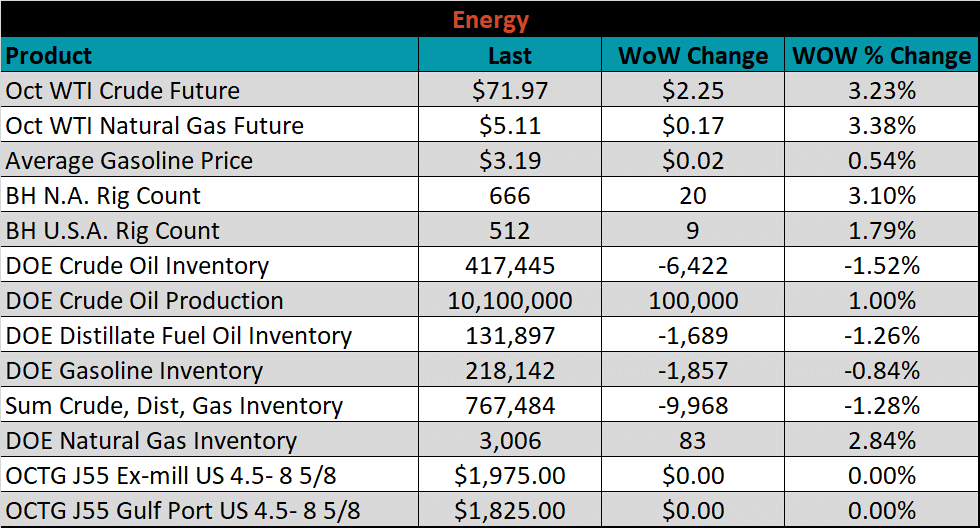
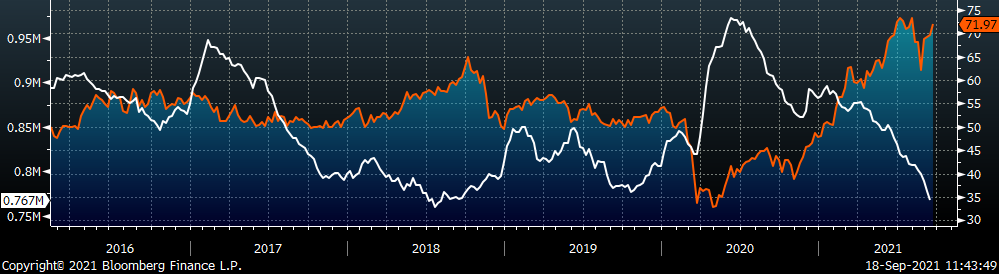
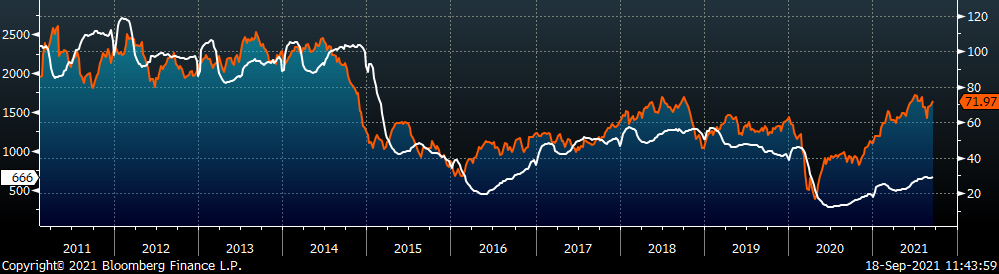
Last week, the October WTI crude oil future was up another $2.25 or 3.2% to $71.97/bbl. The aggregate inventory level was down another 1.3%, and crude oil production increased to 10.1m bbl/day. The Baker Hughes North American rig count was up 20 rigs, and the U.S. rig count was up 9 rigs.
The list below details some upside and downside risks relevant to the steel industry. The bolded ones are occurring or highly likely.
Upside Risks:
Downside Risks: