

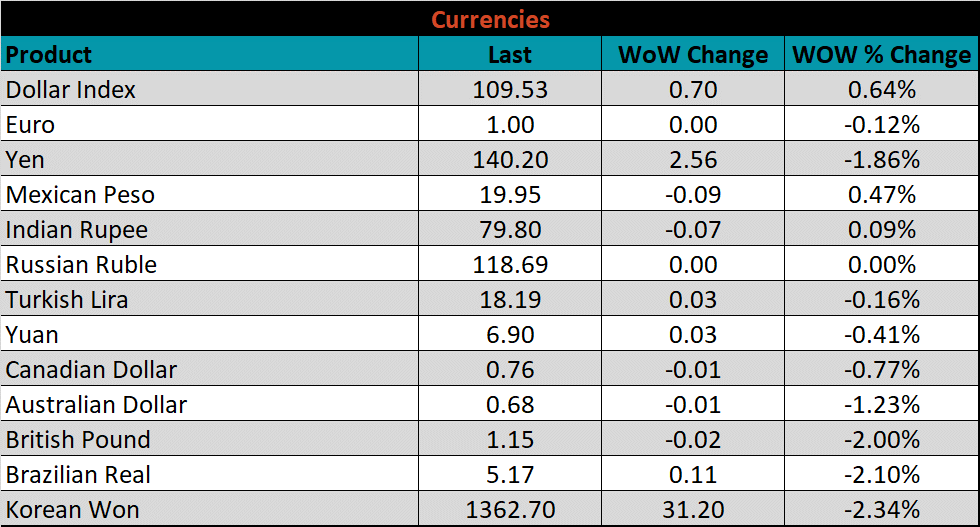
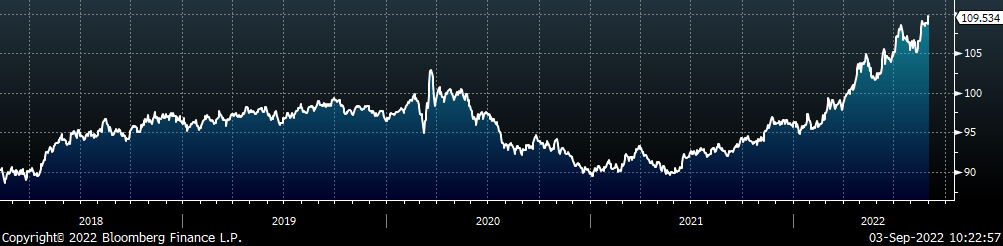
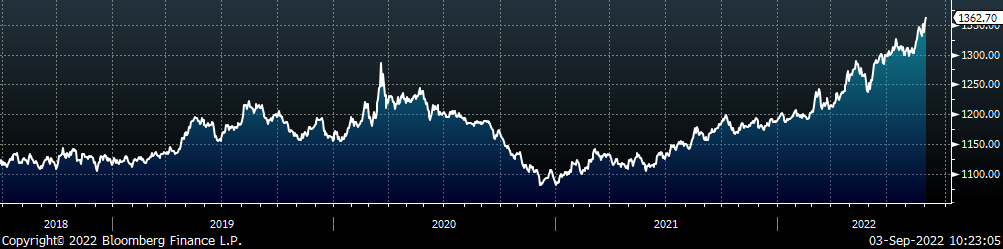
September 2, 2022

Market Commentary
The early August economic data release provides further evidence that the U.S. economy remains resilient compared to the rest of the world, although significant headwinds are mounting for the next 18 months. While this is a welcome sign and clear evidence of a strong manufacturing sector and labor market, it also provides the FED with more runway to increase rates aggressively in their upcoming September meeting. Furthermore, while construction spending data continues to show strong YoY growth, the seasonal spending cycle appears to be peaking earlier than normal. While a reduced pace of spending in the construction industry is not surprising given that it is closely linked to the increasing interest rates, it is another sign of moderation in demand.
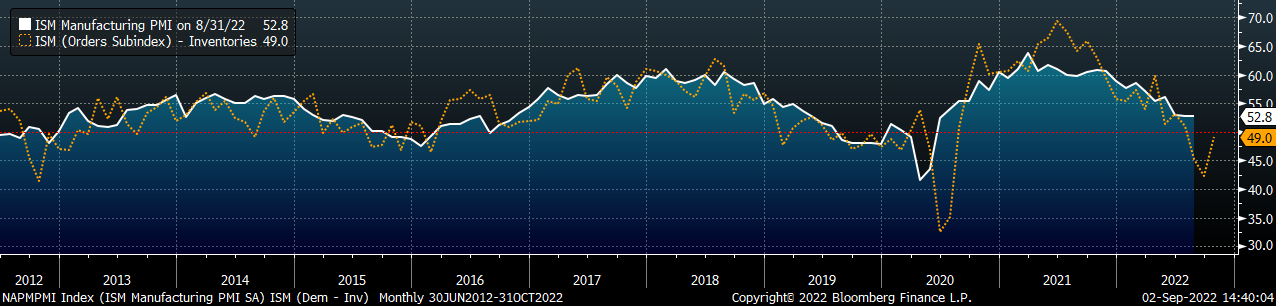
The chart below is comprised of the orders subindexes (new orders & backlog) minus inventories which has been a reliable 2-month leading indicator for the topline number. While still showing a contraction in manufacturing, the latest report helped reverse the sharp decline from preceding months and suggests that a contraction in the manufacturing sector may not be as severe as previously feared. This improvement was the result of declining inventories and an overall increase in demand.
ISM PMI
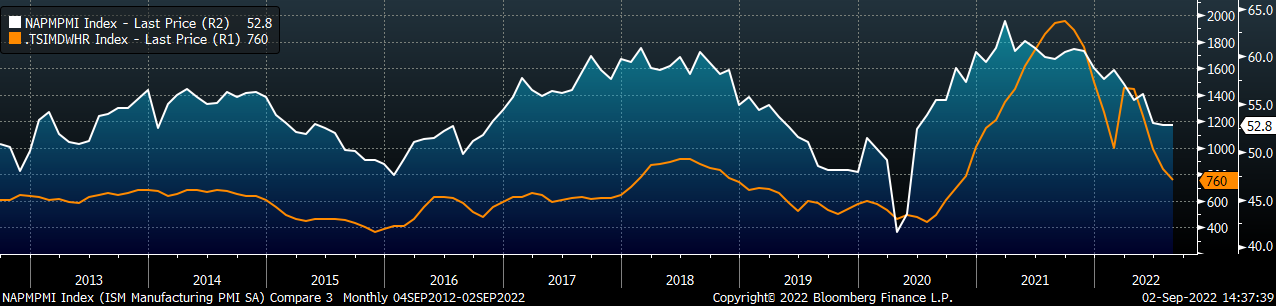
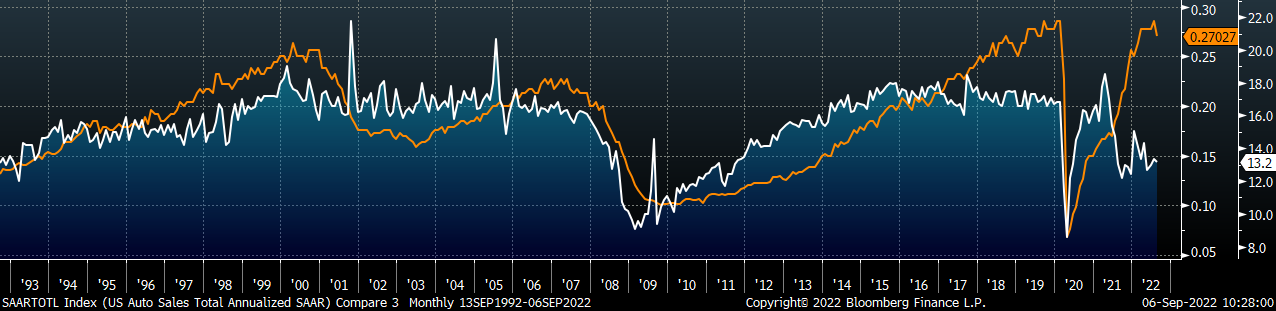
The chart below is the Platts Midwest HRC index (orange) and the ISM Manufacturing PMI (white). The topline ISM Manufacturing PMI index was unchanged but printed above expectations, while the Midwest HRC price fell further in August.
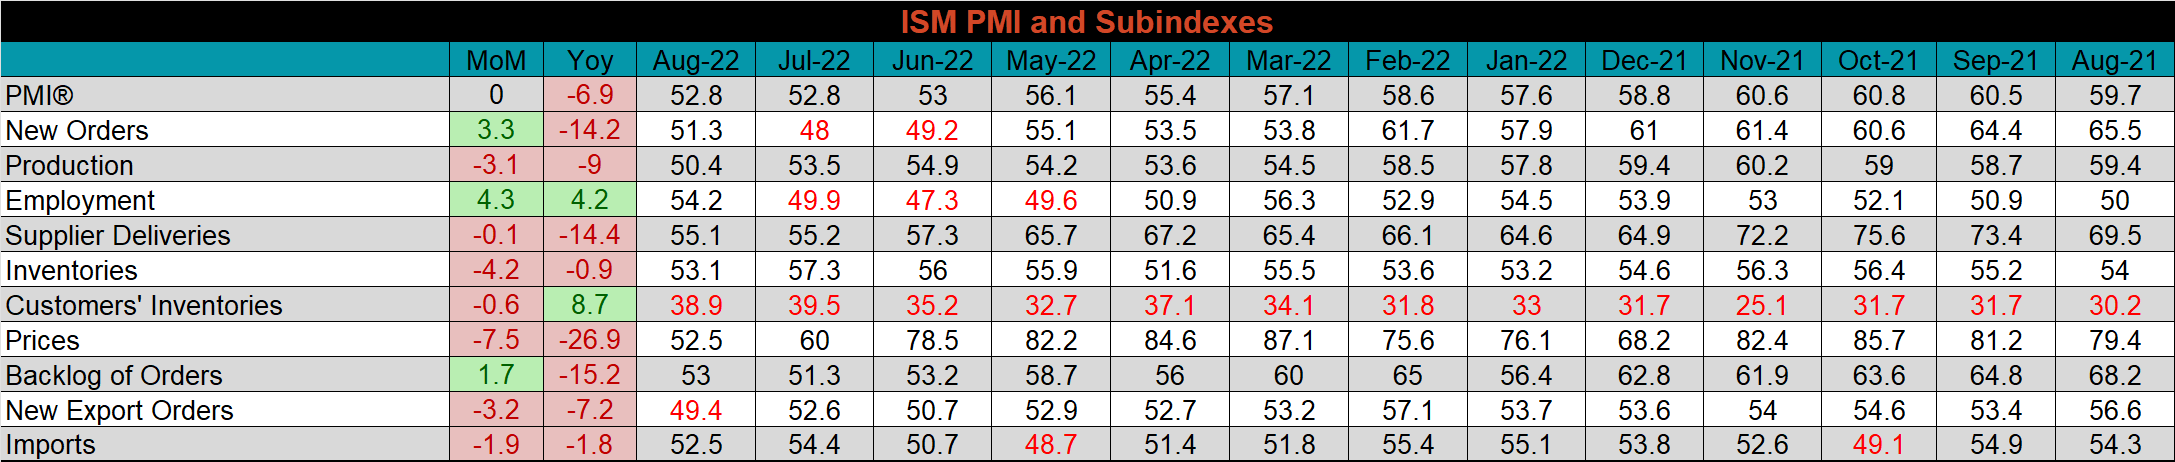
The August ISM Manufacturing PMI and subindexes are below.
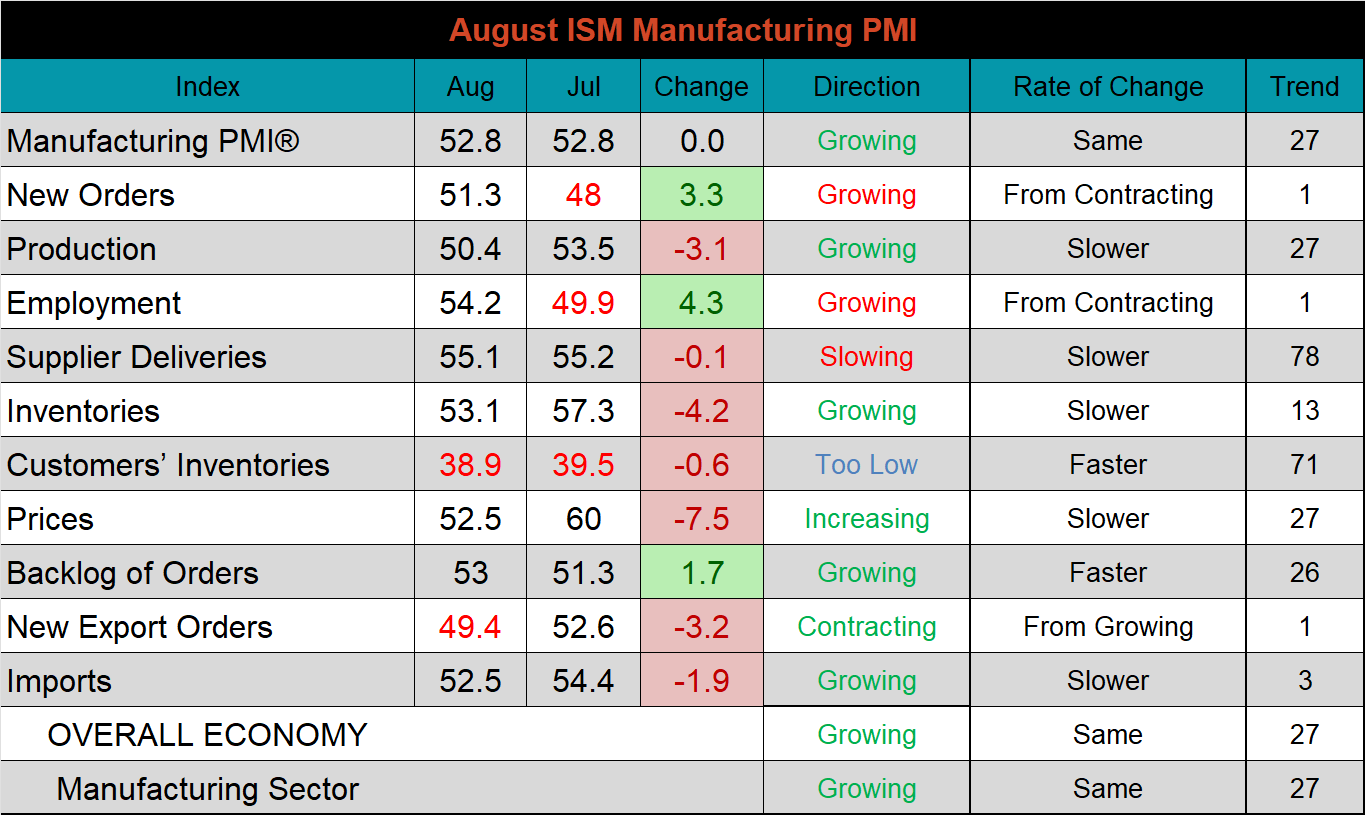
Demand & consumption improved, but inputs were less favorable (while still in expansion territory) compared to July.
- The new orders and the backlog subindex both increased and are in expansion territory, driving demand higher.
- The increase in employment and decrease in inventories more than offset the reduction in production and caused an increase in consumption.
- The sustained reduction in prices helped to keep the Input subindex in expansion territory.
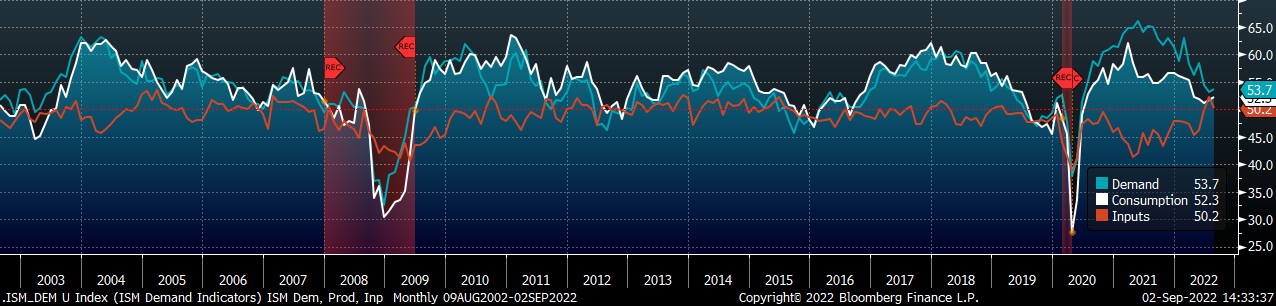
ISM Manufacturing PMI: Demand (blue), Consumption (white), & Inputs (orange)
The table below shows the historical values of each subindex over the last twelve months. The sharp YoY reduction in prices and supplier deliveries is a promising sign for sustained growth in the manufacturing sector. At the same time, new orders and backlogs are also well below their August 2021 levels, suggesting that the rapid expansion from last year has given way to a more cautious, risk-averse approach to growth.
Global PMI
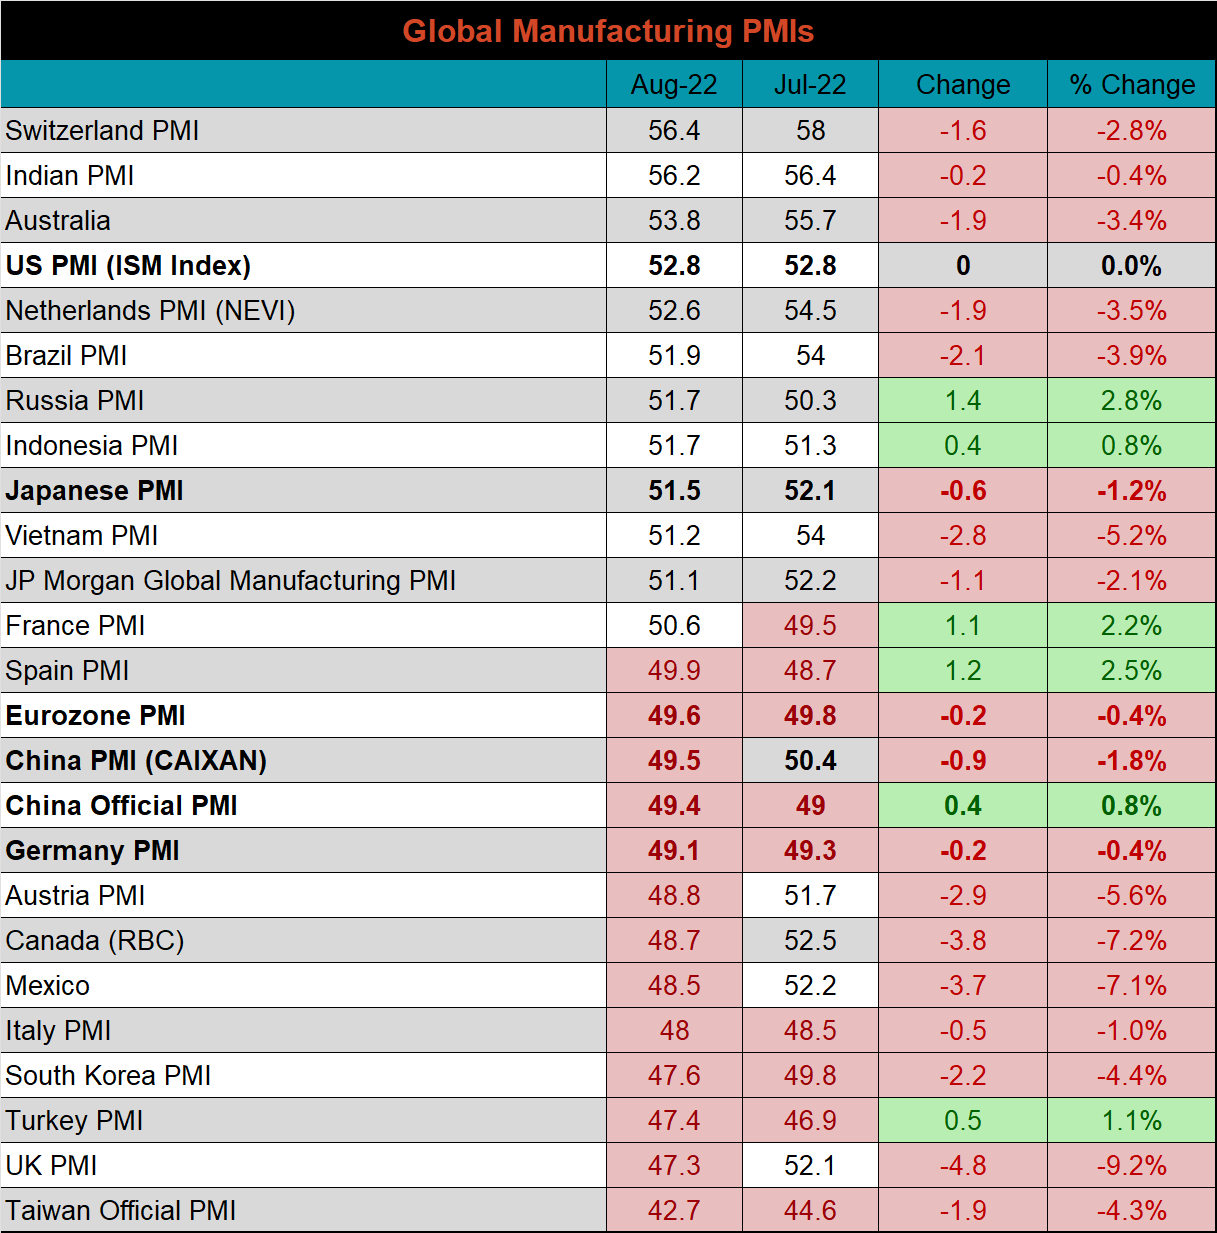
While August U.S. data was encouraging, global PMI data was poor again. Five additional watched countries manufacturing sectors slipped into contraction, while France was the only country that moved into expansion territory.
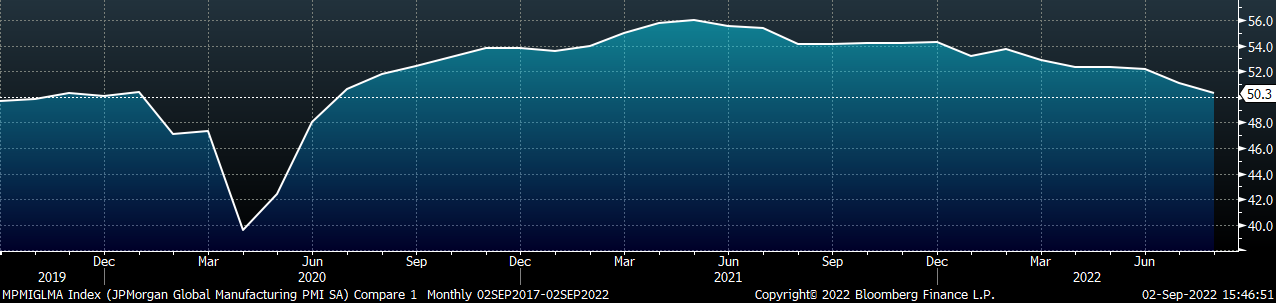
J.P. Morgan Global Manufacturing
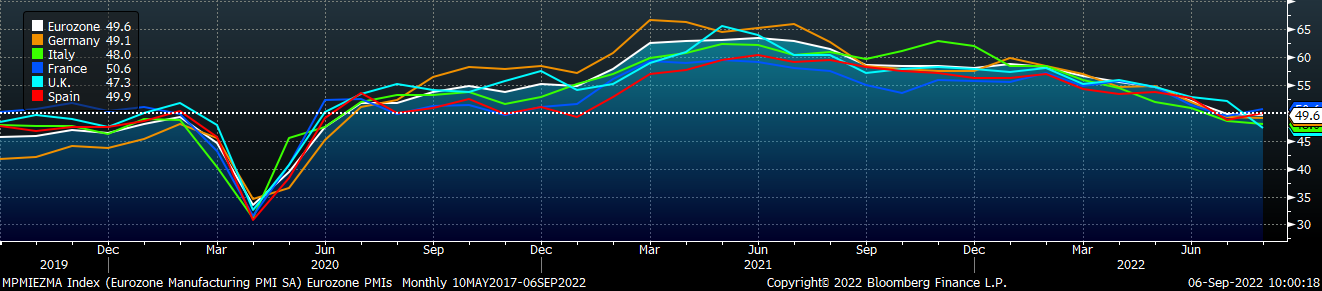
Eurozone (white), German (orange), Italian (green), Spanish (red), and French (blue), U.K. (teal) Manufacturing PMIs
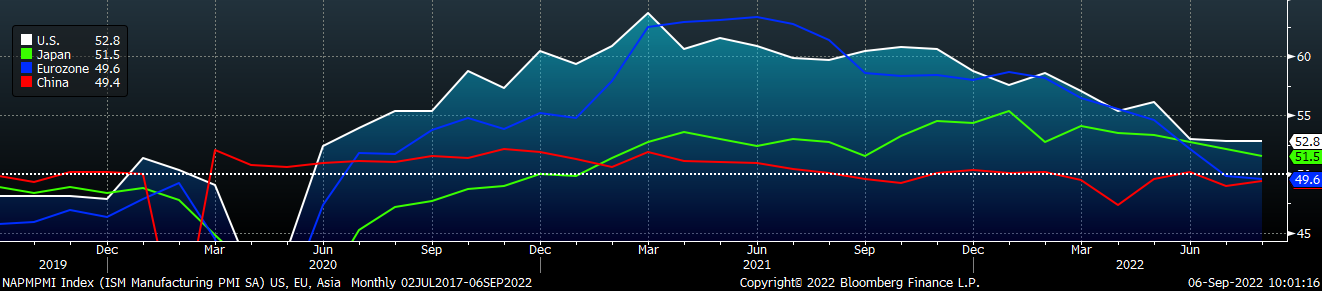
US (white), Euro (blue), Chinese (red) and Japanese (green) Manufacturing PMIs
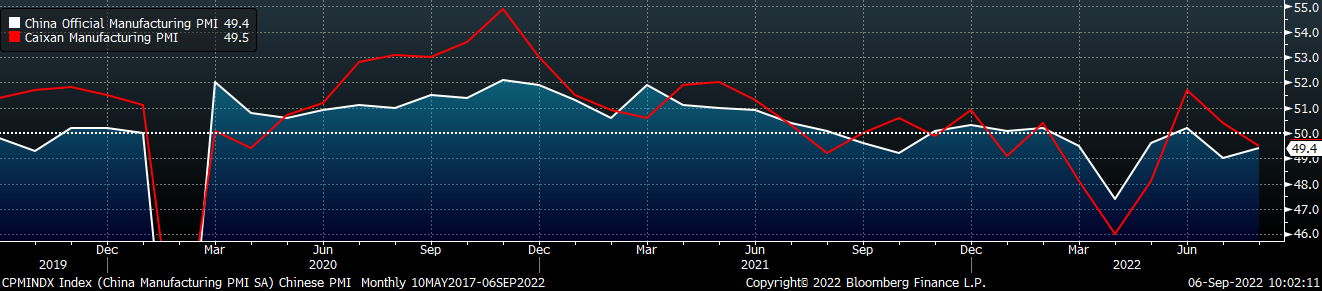
The Caixin PMI index printed lower, while the Chinese official PMI index increased. Both PMIs are back in contraction territory.
China Official (white) and Caixan (red) Manufacturing PMIs
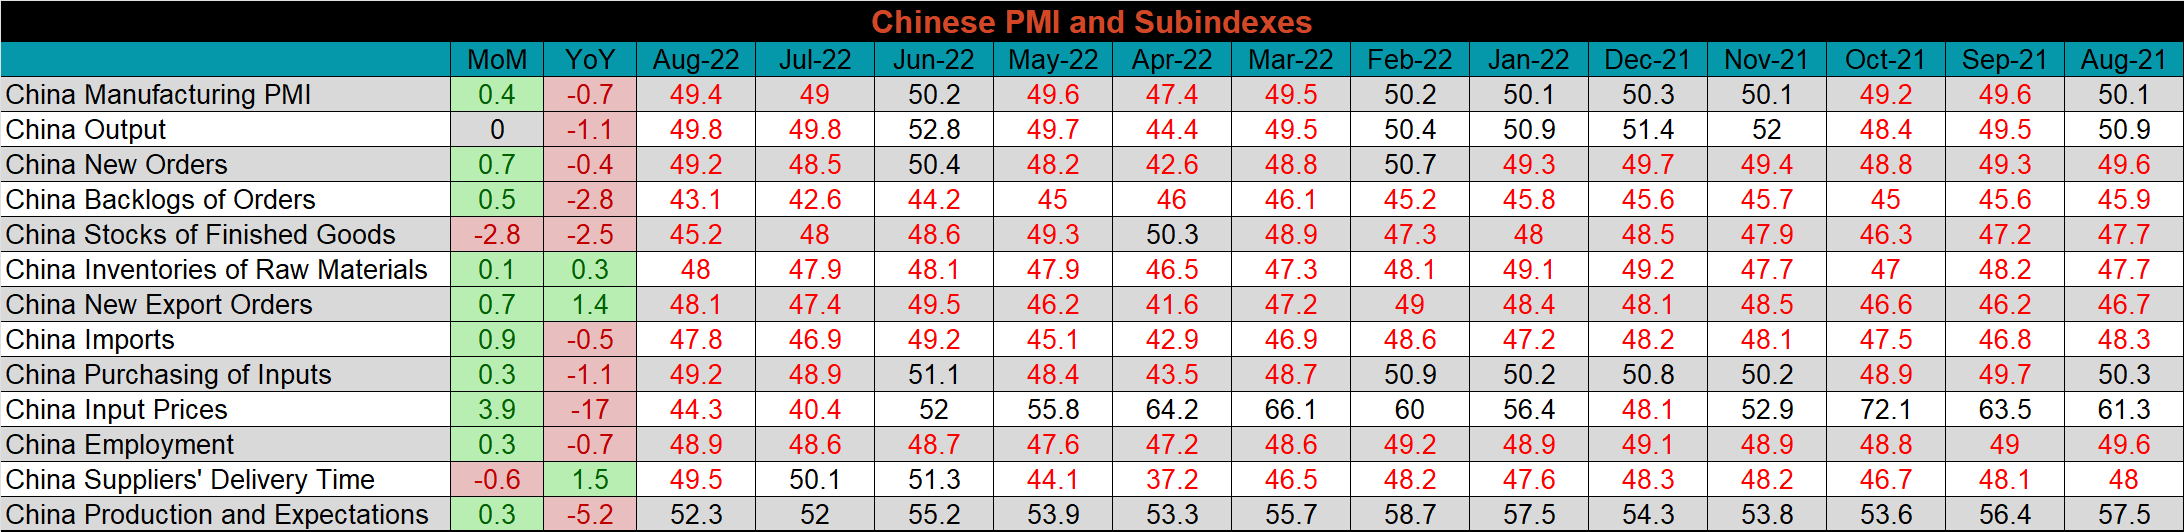
The table below breaks down China’s official manufacturing PMI subindexes. Compared to last month, August marks an improvement, however, the index remains in contraction territory, with only the “production and expectations” subindex printing above 50 and in growth territory. The Chinese economy continues to be hampered by its struggling property sector and its COVID-zero policy.
Construction Spending
July seasonally adjusted U.S. construction spending was down 0.4% MoM, but up 8.4% compared to a year ago. This is the 2nd month that seasonally adjusted growth was negative, suggesting that rising interest rates are starting to affect the construction industry.
July U.S. Construction Spending
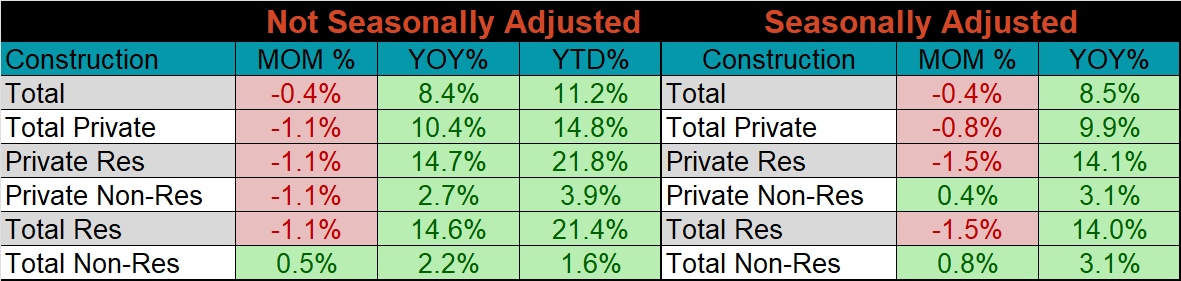
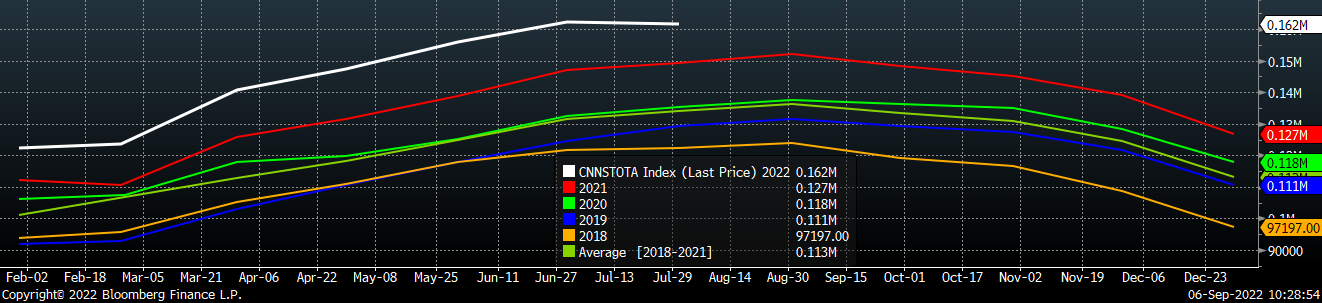
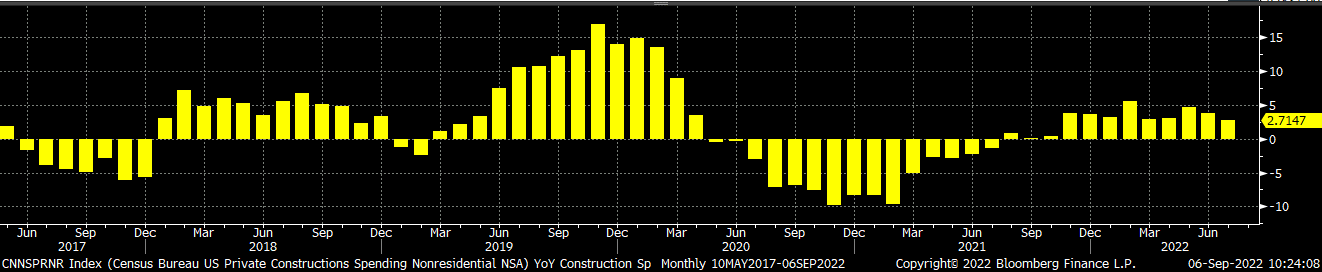
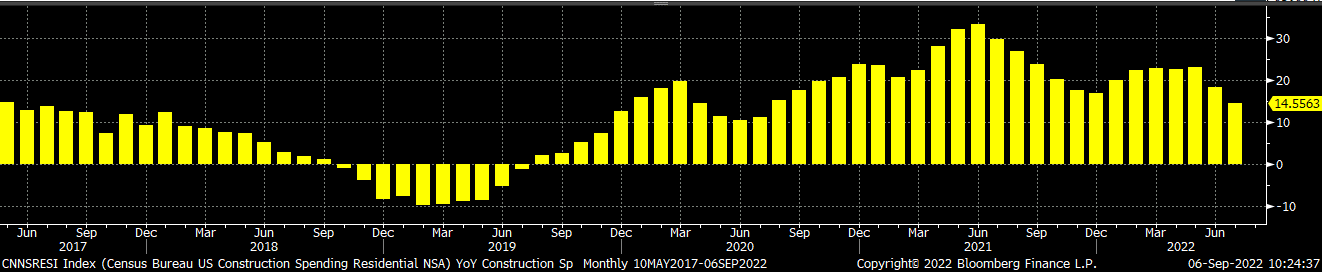
The white line in the chart below shows that not seasonally adjusted construction spending in 2022 may have peaked in June, which is earlier in the year than what is typically expected. The two bottom charts below show the YoY changes in construction spending. Both residential and non-residential spending continue to grow, however, the rate of growth for both of them has been trending lower since May.
U.S. Construction Spending NSA
U.S. Private Nonresidential Construction Spending NSA YoY % Change
U.S. Residential Construction Spending NSA YoY % Change
Auto Sales
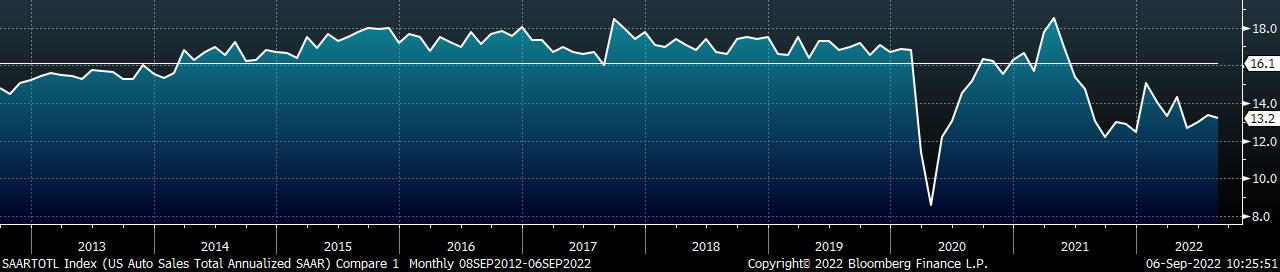
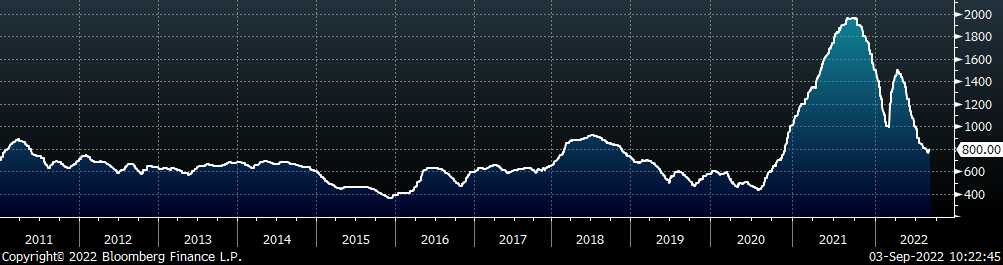
August U.S. light-vehicle sales slipped to a 13.2M seasonally adjusted annualized rate (S.A.A.R). The sales rate has been below the 10-year average of 16.2m since June of last year, as problems with the supply chains persist. The second chart shows the relationship between the unemployment rate and auto sales. The unemployment rate is inverted to show that declining unemployment typically leads to increasing auto sales. While the August jobs report came in slightly above expectations there are a few changes that will require further attention. The slight increase in the unemployment rate, from 3.5% to 3.7%, was the result of an increase in the labor participation rate. While it is too early to be certain, preliminary evidence suggests that this was induced by the stress of high inflation. The FED has made it clear that they are comfortable with higher levels of unemployment, which would soften this bullish signal for auto demand.
August U.S. Auto Sales (S.A.A.R.)
August U.S. Auto Sales (white) and the Inverted Unemployment Rate (orange)
Risks
Below are the most pertinent upside and downside price risks:
Upside Risks:
- China reopening its economy with further stimulus measures
- Unplanned & extended planned outages, including operational issues leaving mills behind
- Energy issues abroad curtailing global production
- Easing supply chain restraints and labor shortages causing an increase in manufacturing activity
- Reluctance in placing import orders, leading to a dramatic reduction in arrivals later this year
Downside Risks:
- Decreasing input costs allowing mills to aggressively sell lower while remaining profitable
- Increased domestic production capacity leading to an increase in competitive pricing
- Steel consumers substitute to lower-cost alternatives
- Limited desire to restock at elevated prices and persistently short lead times causing a “Buyer’s Strike”
- Economic slowdown caused by increasing interest rates
HRC Futures
All of the below data points are as of September 2, 2022.
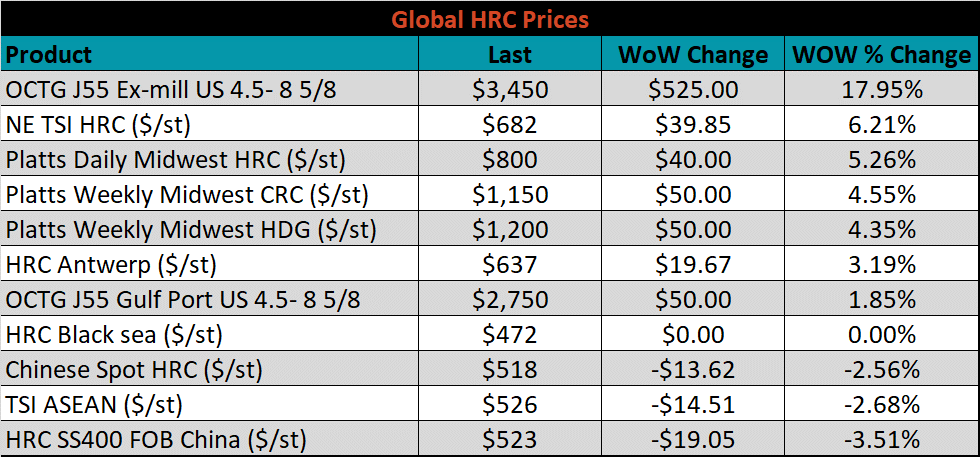
The Platts TSI Daily Midwest HRC Index was up $40 to $800.
Platts TSI Daily Midwest HRC Index
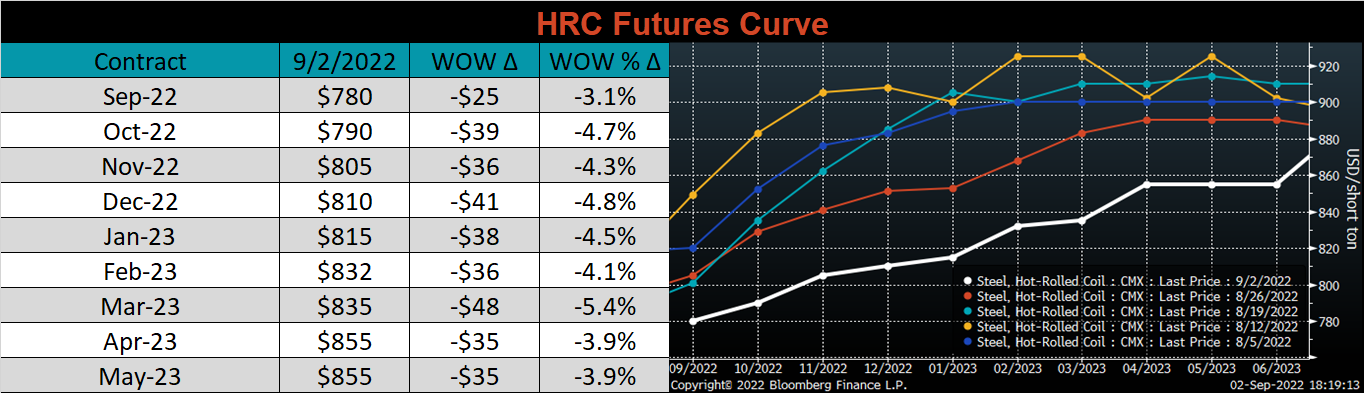
The CME Midwest HRC futures curve is below, with last Friday’s settlements in white. The entire curve shifted $35-40 lower last week on the back of a worsening macro backdrop, declining input costs, and a stronger dollar.
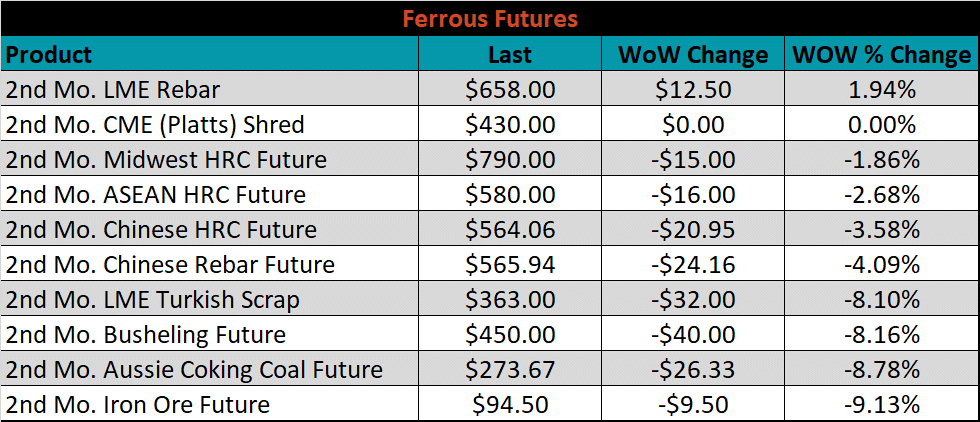
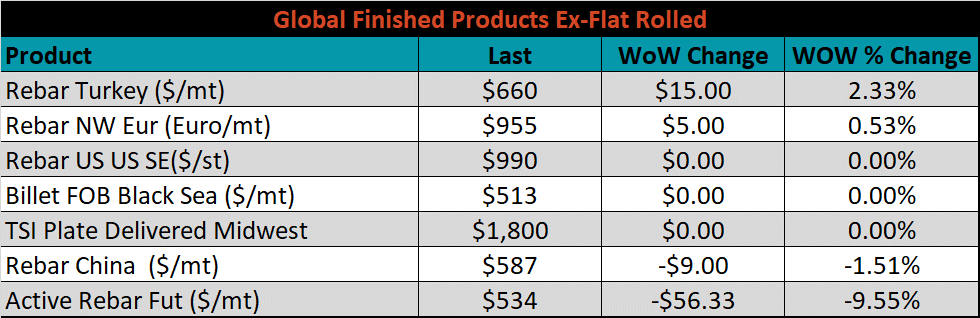
The 2nd month ferrous futures ended the week sharply lower led by iron ore, which lost 9.1%, while Turkish rebar gained 1.9%.
Global flat rolled indexes were mixed last week. Northern European HRC was up 6.2%, while Chinese spot HRC was down 3.5%.
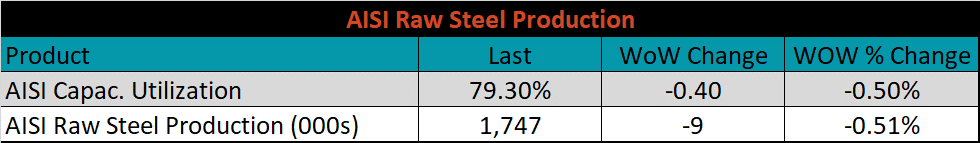
The AISI Capacity Utilization was down 0.4% to 79.3%.
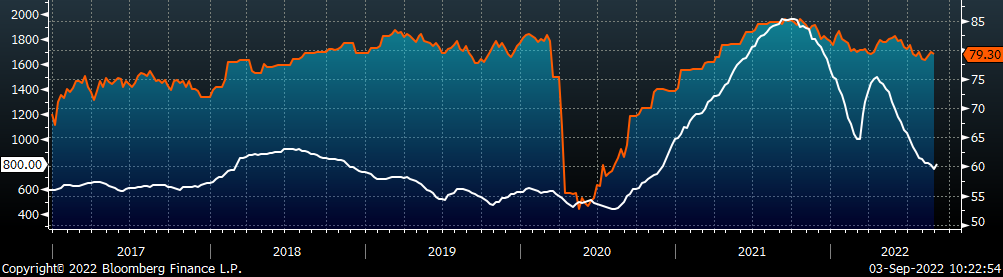
AISI Steel Capacity Utilization Rate (orange) and Platts TSI Daily Midwest HRC Index (white)
Imports & Differentials
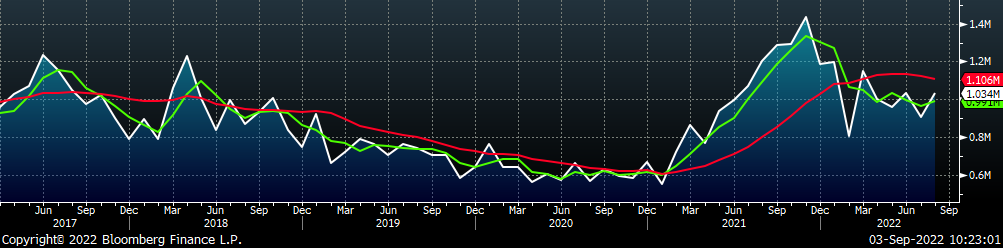
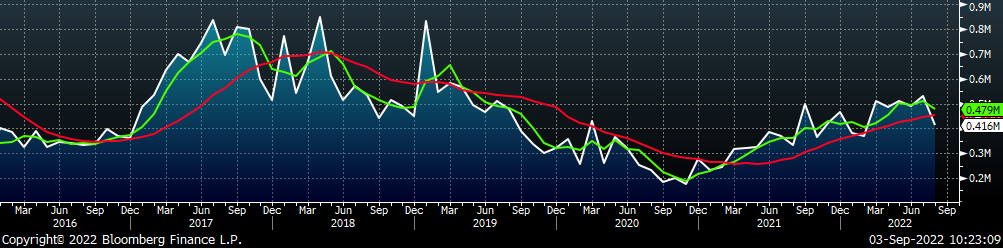
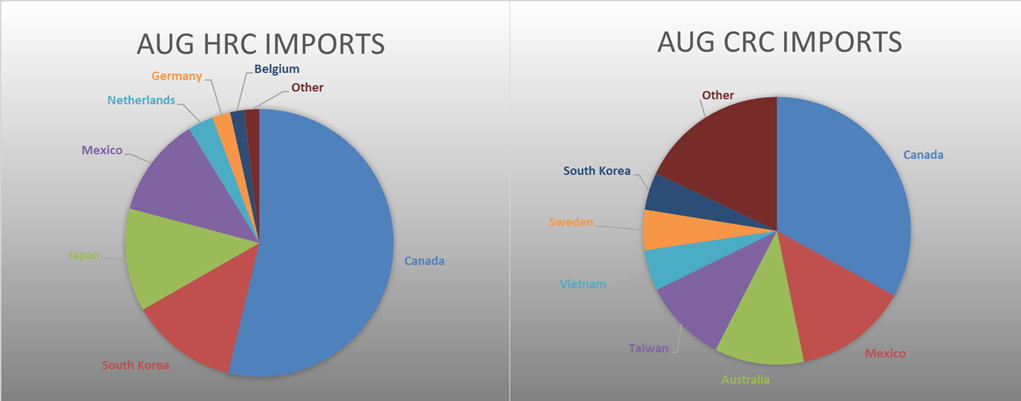
August flat rolled import license data is forecasting an increase of 130k to 1,034 MoM.
All Sheet Imports (white) w/ 3-Mo. (green) & 12-Mo. Moving Average (red)
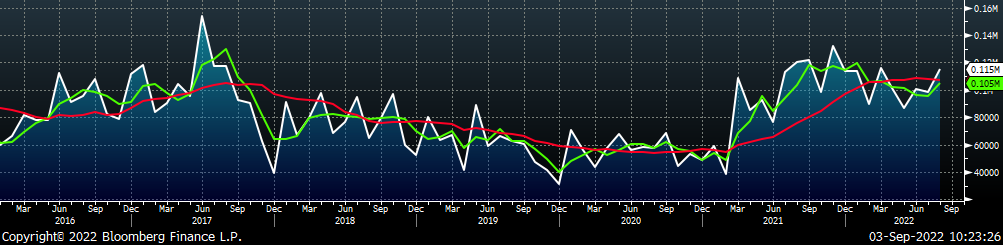
Tube imports license data is forecasting a decrease of 117k to 416k in August.
All Tube Imports (white) w/ 3-Mo. (green) & 12-Mo. Moving Average (red)
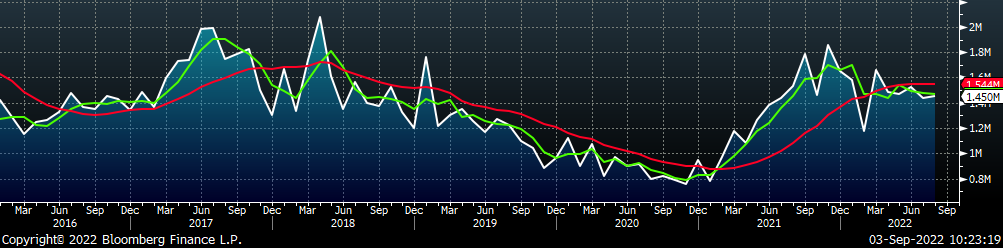
All Sheet plus Tube (white) w/ 3-Mo. (green) & 12-Mo. Moving Average (red)
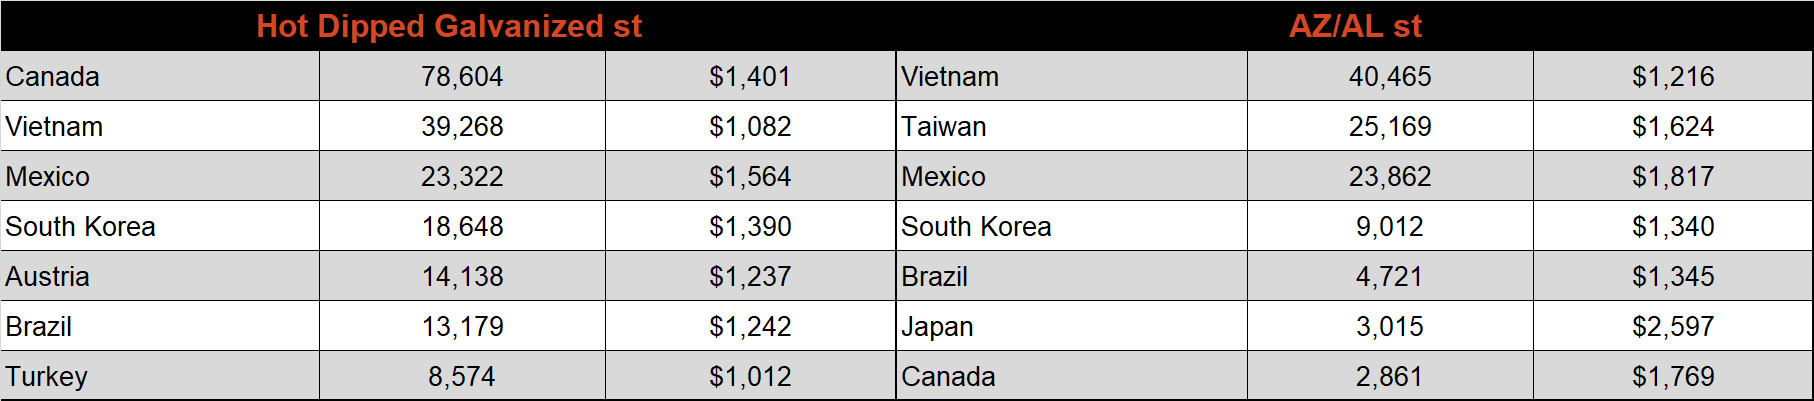
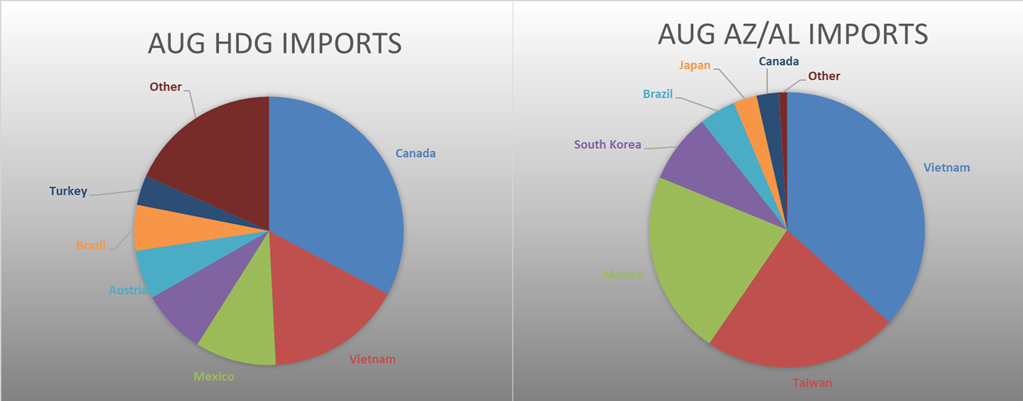
August AZ/AL import license data is forecasting an increase of 17k to 115k.
Galvalume Imports (white) w/ 3 Mo. (green) & 12 Mo. Moving Average (red)
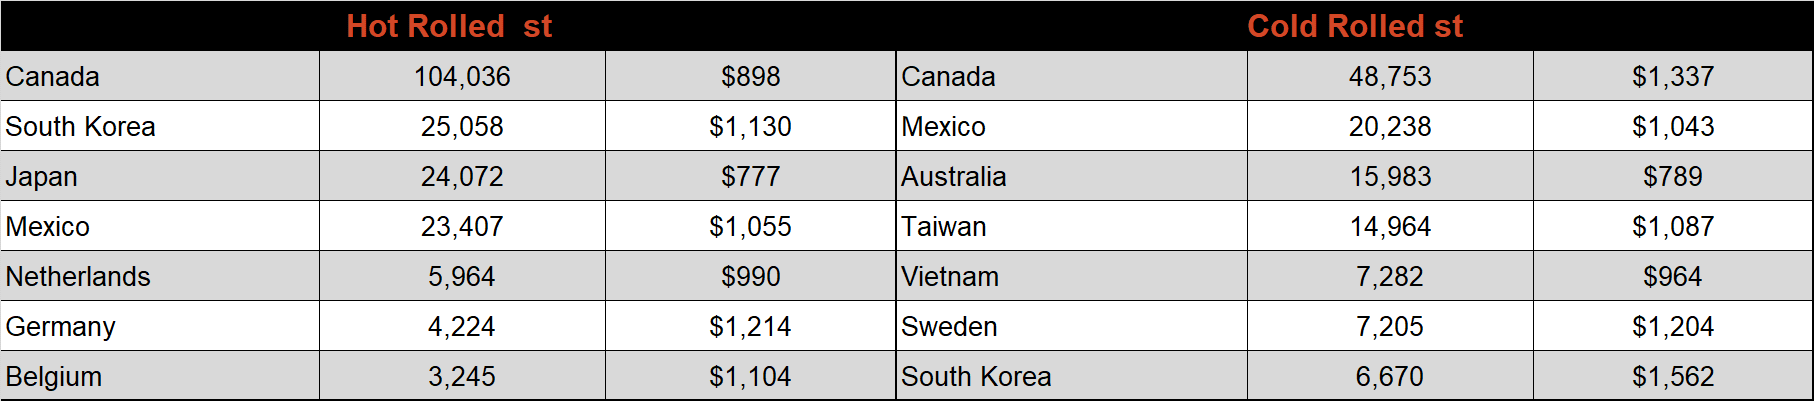
Below is August import license data through August 29th, 2022.
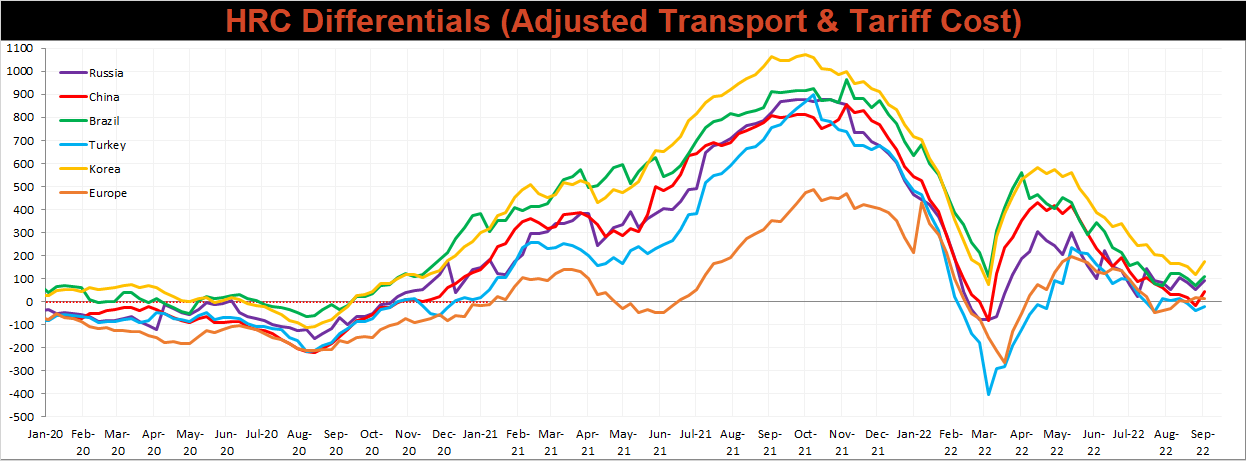
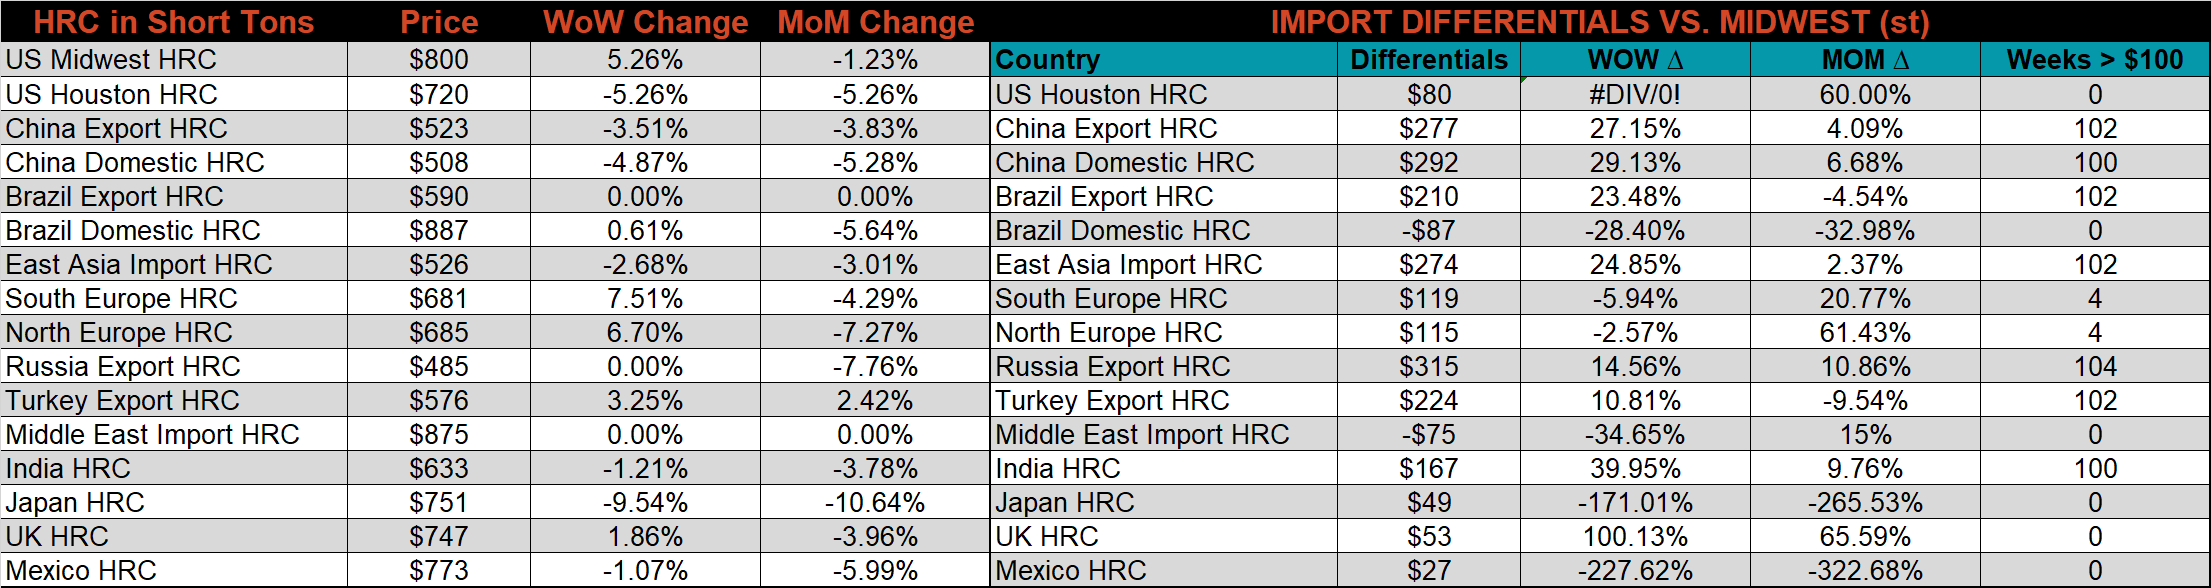
Below is the Midwest HRC price vs. each listed country’s export price using pricing from SBB Platts. We have adjusted each export price to include any tariff or transportation cost to get a comparable delivered price. Differentials for all the watched countries increased last week, as the U.S. Midwest price rebounded after falling below $800 two weeks ago.
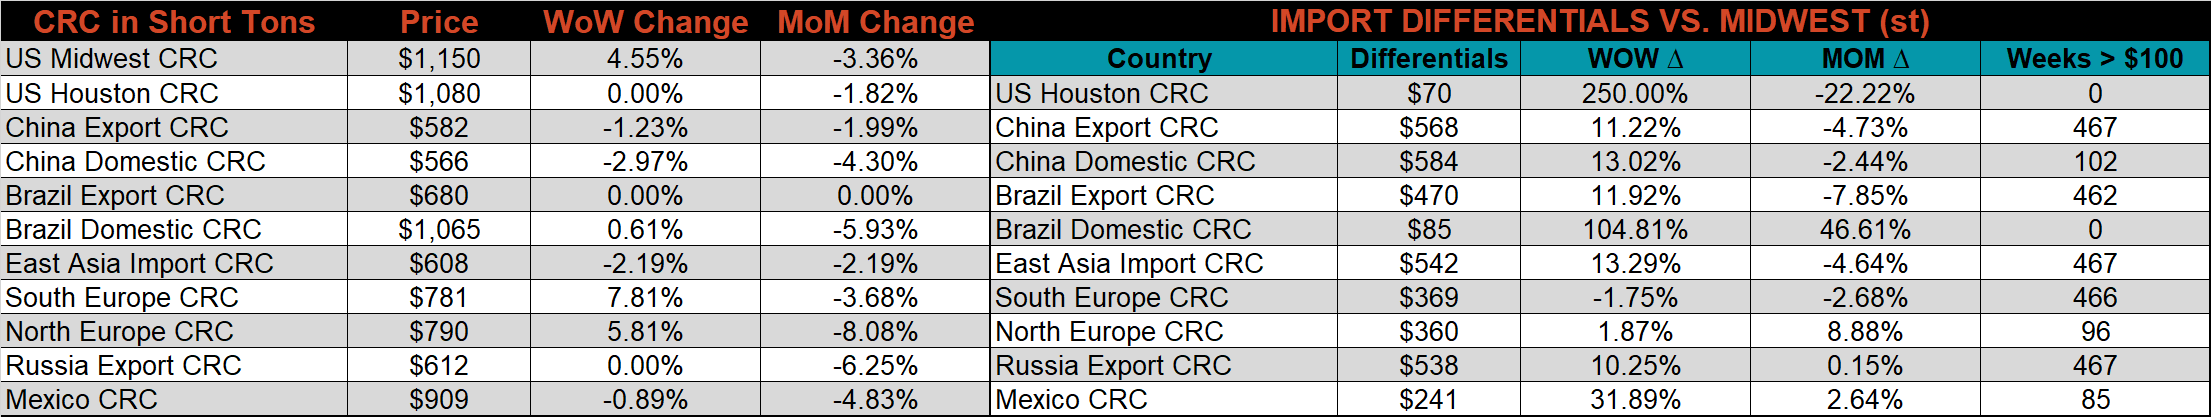
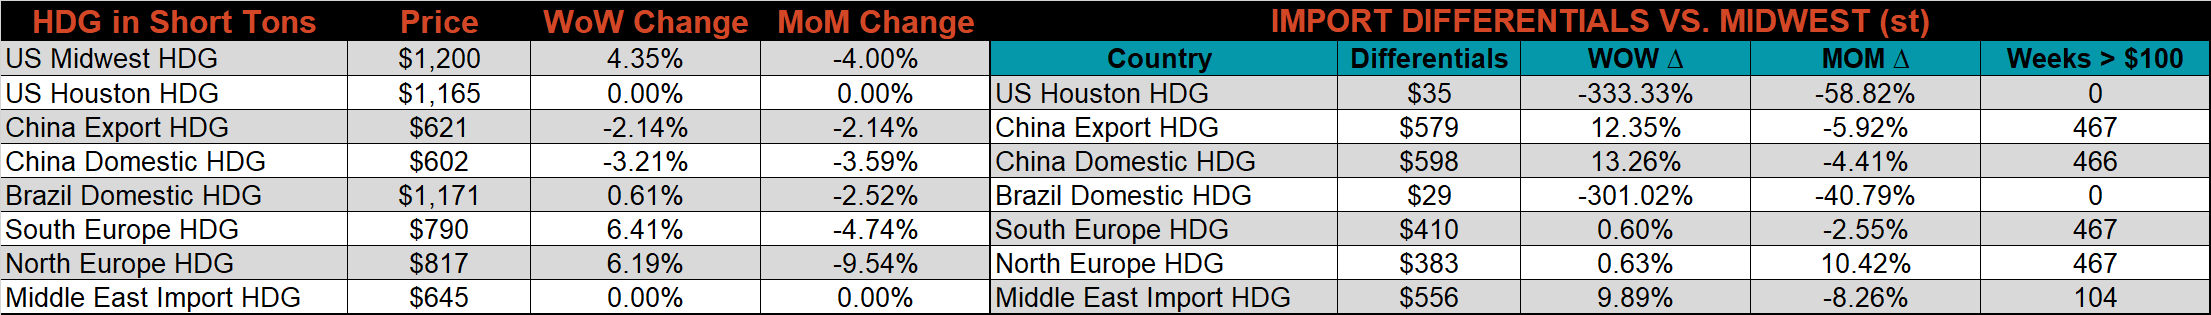
SBB Platt’s HRC, CRC, and HDG pricing is below. The Midwest HRC, CRC, & HDG prices were up 5.3%, 4.6%, and 4.4%, respectively.
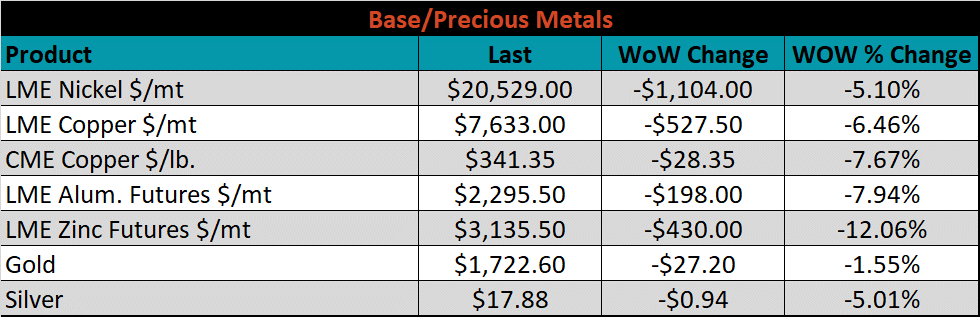
Raw Materials
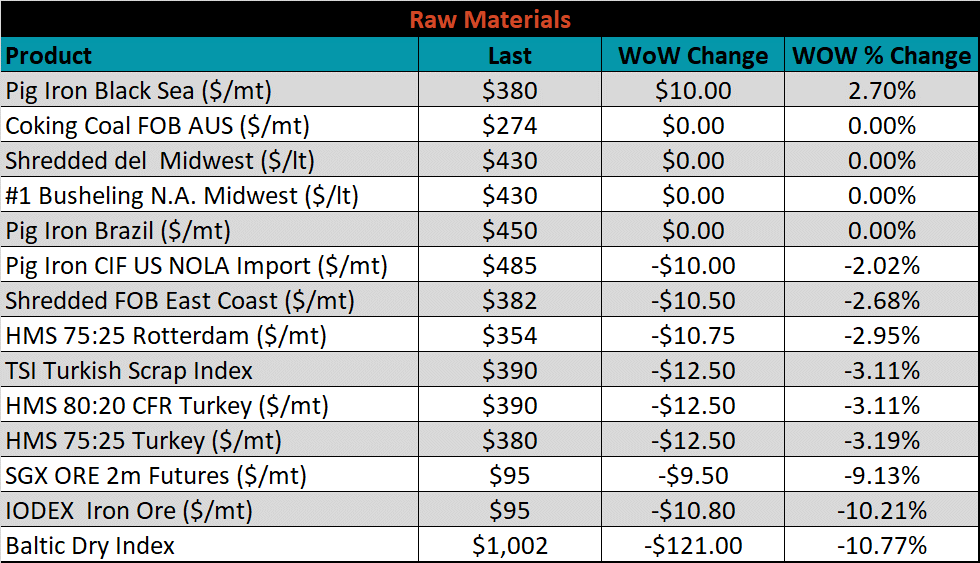
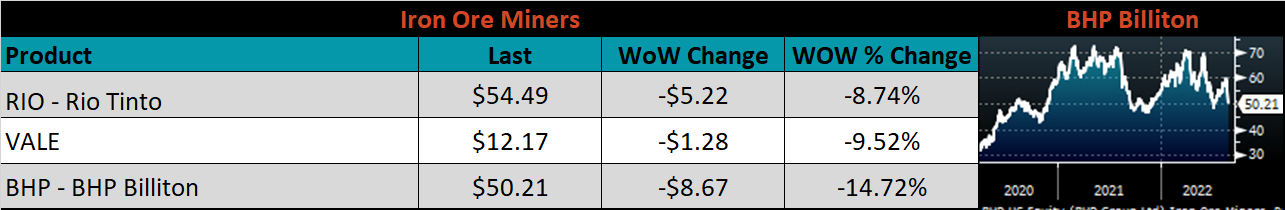
Raw material prices were mostly lower last week, with the IODEX iron ore index down 10.2%, while Black Sea pig iron ore was up 2.7%.
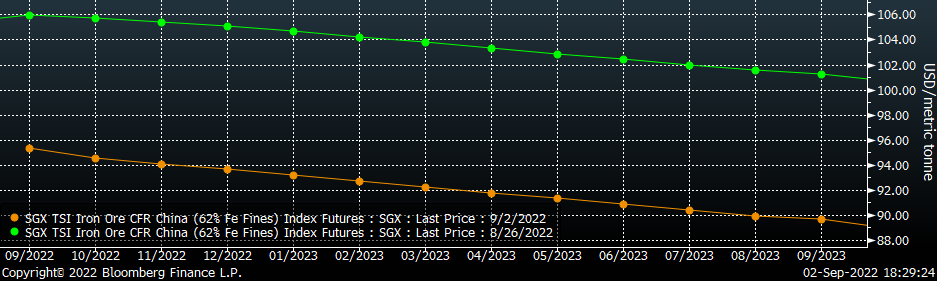
Below is the iron ore future curve with Friday’s settlements in orange, and the prior week’s settlements in green. Last week, the entire curve shifted significantly lower and appeared to finally break out below its tight range.
SGX Iron Ore Futures Curve
The ex-flat rolled prices are listed below.

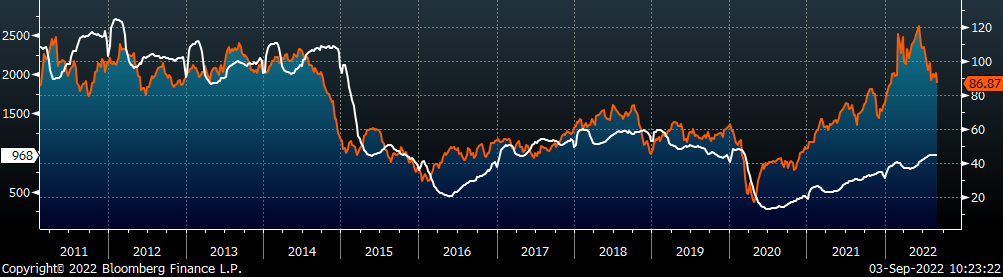
Energy
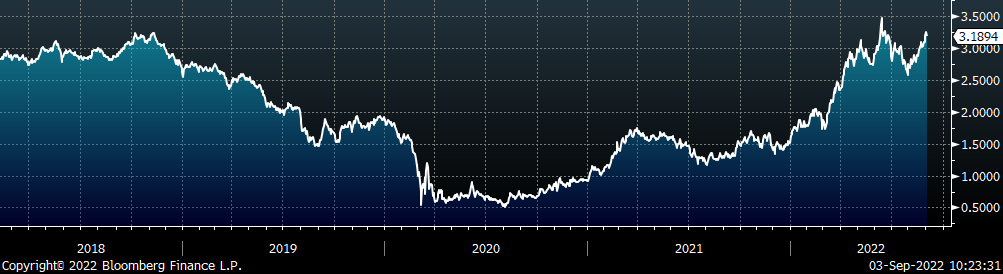
Last week, the October WTI crude oil future lost $6.19 or 6.7% to $86.87/bbl. The aggregate inventory level decreased another 0.6%. The Baker Hughes North American rig count increased by 3 rigs, while the U.S. rig count decreased by 5 rigs.
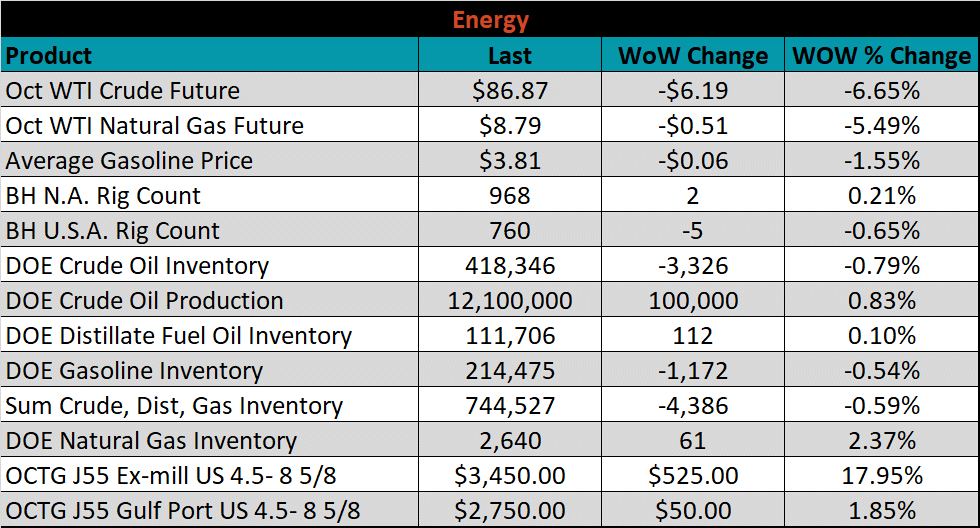
October WTI Crude Oil Futures (orange) vs. Aggregate Energy Inventory (white)
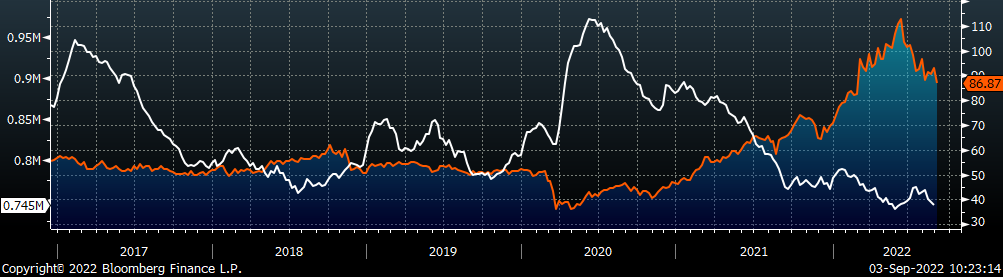
Front Month WTI Crude Oil Future (orange) and Baker Hughes N.A. Rig Count (white)
The list below details some upside and downside risks relevant to the steel industry. The bolded ones are occurring or highly likely.
Upside Risks:
- Inventory at end users and service centers below normal operational levels
- A higher share of discretionary income allocated to goods from steel-intensive industries
- Changes in China’s policies regarding ferrous markets, including production cuts and exports
- Unplanned & extended planned outages, including operational issues leaving mills behind
- Energy issues abroad curtailing global production
- Easing labor and supply chain constraints allowing increased manufacturing activity
- Mills extending outages/taking down capacity to keep prices elevated
- Global supply chains and logistics restraints causing regional shortages
- Fiscal policy measures including a new stimulus package
- Contentious union labor negotiations leading to supply disruption
- Fluctuating auto production, pushing steel demand out into the future
- The threat of further protectionist trade policies muting imports
Downside Risks:
- Increased domestic production capacity
- Elevated price differentials and hedging opportunities leading to sustained higher imports
- Steel consumers substitute to lower cost alternatives
- Steel buyers and consumers “double ordering” to more than cover steel needs
- Tightening credit markets, as elevated prices push total costs to credit caps
- Supply chain disruptions allowing producers to catch up on orders
- Limited desire to restock at elevated prices, causing a “Buyer’s Strike”
- Economic slowdown caused by the emergence of Coronavirus Variants
- Reduction and/or removal of domestic trade barriers
- Political & geopolitical uncertainty
- Chinese restrictions in the property market
- Unexpected sharp China RMB devaluation