Content
-
Weekly Highlights
- Market Commentary
- Upside & Downside Risks


In our view, the FED hiking cycle is the most important factor in global markets at present, and will outweigh fundamental market dynamics across various asset classes – including steel. The unambiguous stance of inflation chasing will be bearish for the steel industry. Last week was uniquely important due to the FOMC meeting which resulted in the third consecutive 75 basis point increase to the Fed Funds target rate. The chart below shows the upper-bound FFTR (white) and the dollar spot index (orange) starting in the early ’90s.

The relationship between interest rates and the US dollar is clear: As rates rise, so does the demand for US Dollars, thereby increasing the value of the dollar relative to other global currencies. Consequently, dollar-denominated goods such as many of the world’s commodities become more expensive to global consumers, which hinders demand for those goods.
One of the most important parts of Wednesday’s event came from the press conference, where Chairman Powell confirmed the Fed’s hawkish stance before answering questions by saying “So, I will answer your question directly, but I want to start here by saying that my main message has not changed at all since Jackson Hole.” Our August 26th report noted just how hawkish the Jackson Hole speech was, and how resolved the group was to tackle inflation, even if it meant slowing the economy.
While the FFTR and US Dollar have risen at the sharpest pace in the last 30 years due to aggressive Fed policy, they are still below the peak levels observed over that time. With only two FOMC meetings left on the schedule for the year, the dot plots project an additional 75 basis point hike in the early November meeting and an additional 50 basis point hike in mid-December. This would put the target rate at 4.5% by the end of the year. If inflation persists longer than anticipated, there is runway for further increases based on historical levels.
While we expect hawkish fed policy to weigh on steel prices in the short-term, the U.S. market has a larger share of EAF production than anywhere else in the world. Their unique ability to throttle production to meet existing demand is going to be a factor. They will not sit idly by as margins shrink and we expect to see additional supply curtailments. These two competing forces will heighten volatility over the coming months.

Below are the most pertinent upside and downside price risks:
Upside Risks:
Downside Risks:

The Platts TSI Daily Midwest HRC Index was down another $10 to $790.

The CME Midwest HRC futures curve is below, with last Friday’s settlements in white. The entire curve continued its trend over the last three weeks and shifted lower. The 1Q23 is now trading at its lowest level since the contract began trading.

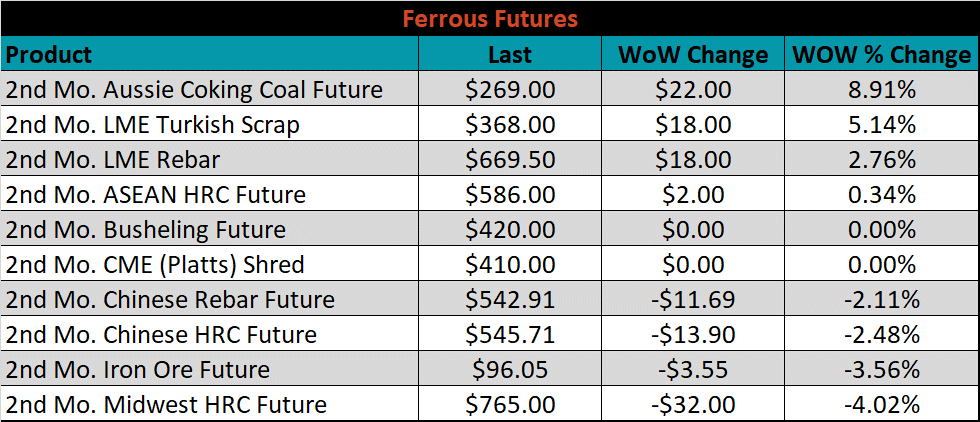
The 2nd month ferrous futures were mixed with Aussie coking coal gaining 8.9%, while Midwest HRC lost another 4% to trade at the lowest price since November 2020.
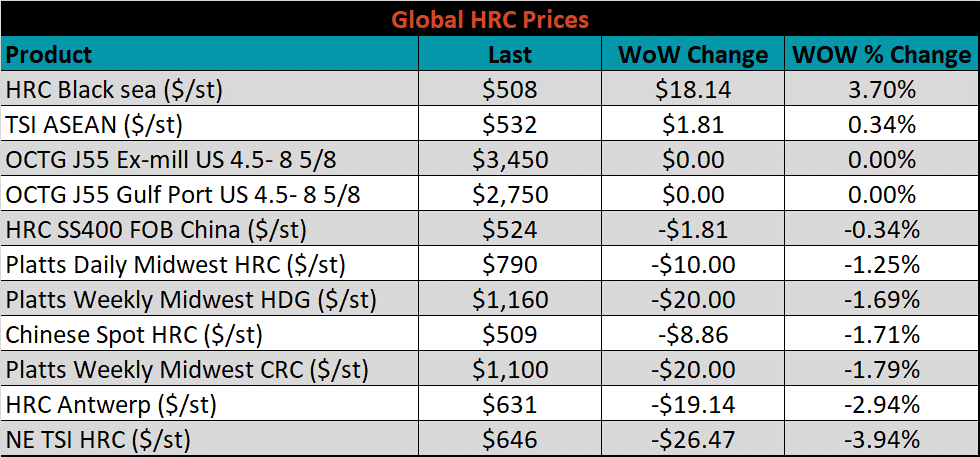
Global flat rolled indexes were mixed last week, with Northern European HRC down 3.9%, while Black Sea HRC gained 3.7%.
The AISI Capacity Utilization was down 1.3% to 76.9%, the lowest since January 2021.


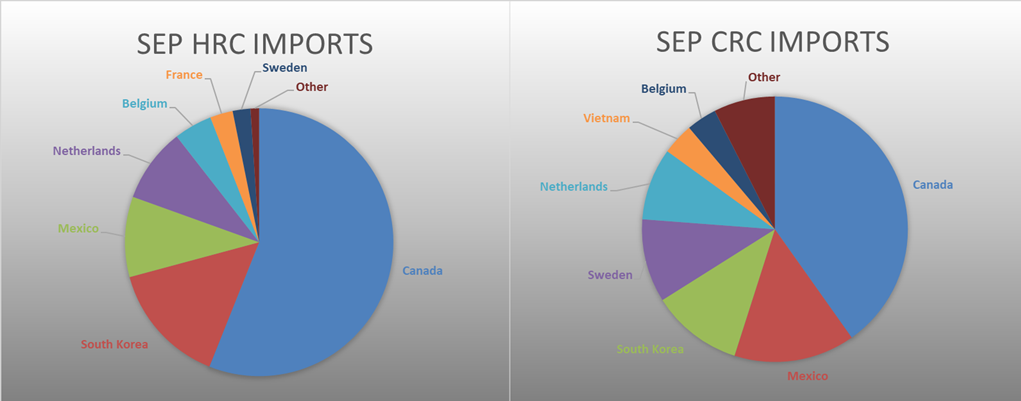
September flat rolled import license data is forecasting a significant decrease of 205k to 802k MoM.

Tube imports license data is forecasting an increase of 62k to 512k in September.


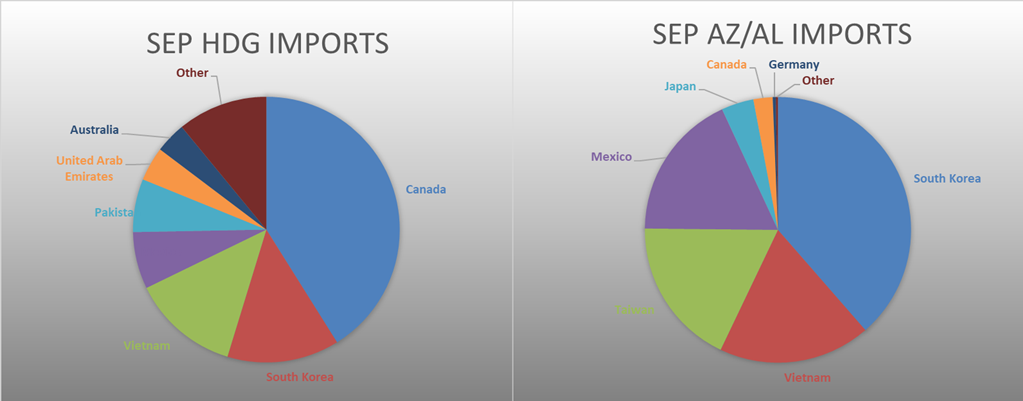
September AZ/AL import license data is forecasting for no change at 115k.

Below is September import license data through September 19th, 2022.


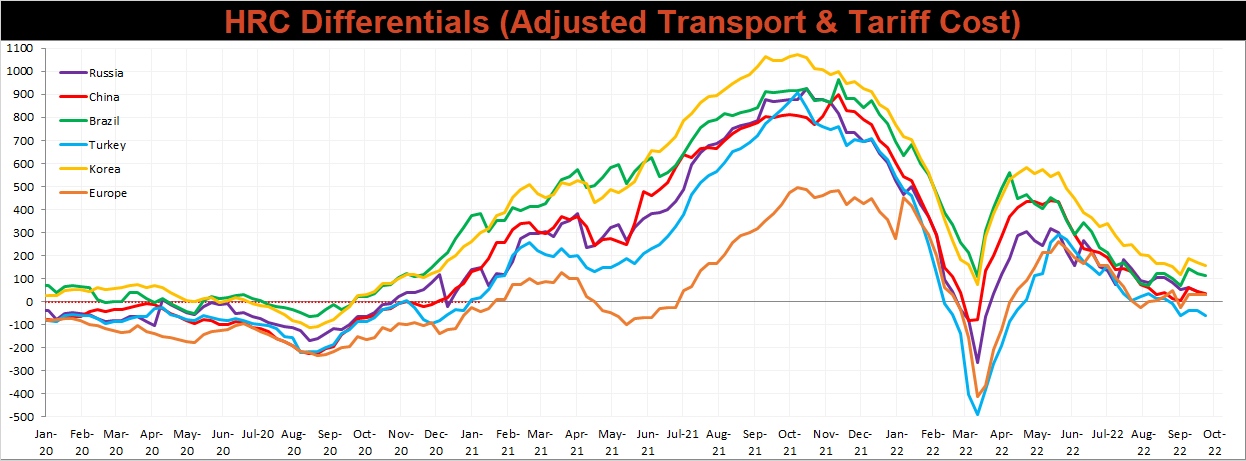
Below is the Midwest HRC price vs. each listed country’s export price using pricing from SBB Platts. We have adjusted each export price to include any tariff or transportation cost to get a comparable delivered price. Differentials decreased for all the watched countries, apart from Northern Europe, which was weaker than U.S. domestic HRC for the 3rd week in a row.
Global prices were mostly lower, led by the U.K. HRC price which was down the most, 5.3%, while Turkish export HRC was up 1.5%.


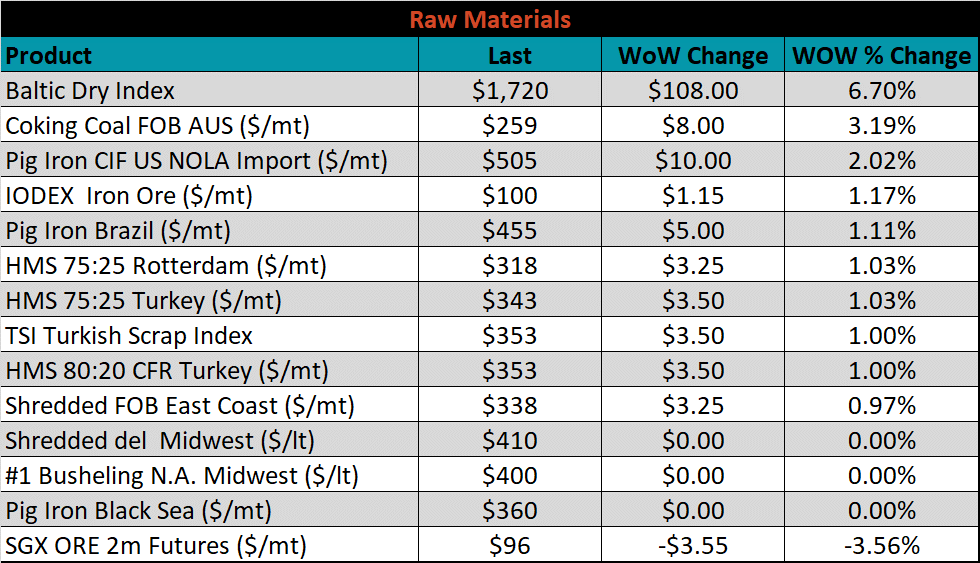
Raw material prices were mostly stable or higher, with Aussie coking coal up another 3.2%, while iron ore lost 3.6%.
Below is the iron ore future curve with Friday’s settlements in orange, and the prior week’s settlements in green. Last week, the entire curve shifted slightly lower, most significantly in the back of the curve.

The ex-flat rolled prices are listed below.


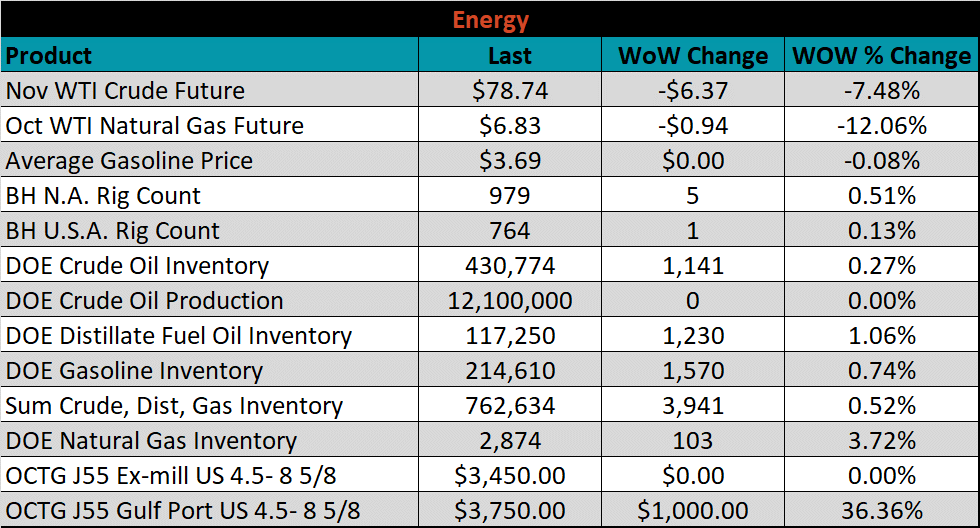
Last week, the November WTI crude oil future lost another $6.37 or 7.5% to $78.74/bbl. The aggregate inventory level increased another 0.5%. The Baker Hughes North American rig count increased by 5 rigs, while the U.S. rig count increased by 1 rig.


The list below details some upside and downside risks relevant to the steel industry. The bolded ones are occurring or highly likely.
Upside Risks:
Downside Risks: