Content
-
Weekly Highlights
- Market Commentary
- ISM PMI
- Global PMI
- Construction Spending
- Auto Sales
- Risks


The current price rally accelerated last week, with spot prices moving up significantly towards $540/st, indicating the mills have captured the full price increase from two weeks ago. Moreover, the dynamics that have supported the current price rally remain intact, with spot availability sparse, extended lead times and increasing scrap prices. The second week of the month has historically been an inflection point for mills, as many of their contracts are priced based on index prints during this week. Mills have been in a pattern of holding off on negotiating at the beginning of the month in order to keep the spot index high, and then switching into an order taking mode through lowering offer prices at the end of the month. This trend appears to have broken, as some mills are still holding off on new spot quotes because their order book may be oversubscribed. This is a noticeable shift for this point in the month compared to the past months, and likely means mills see support for even higher prices.
A driver of the support for higher prices has been extended lead times, partially driven by planned maintenance outages. A key indicator of the sustainability of this rally will be how lead times react once outages end and production levels increase. This week, we will dive into insights from last week’s ISM Manufacturing PMI report to better understand the dynamics that may influence lead times going forward. The chart below shows the new orders-to-inventories ratio, using the respective subindexes from the PMI report.

Increases in this ratio indicate that inventory levels are declining relative to the amount of expressed demand for that inventory. However, as this ratio moves up to historically elevated levels, as it is now, it signals that manufacturers are running thin on the inventory that their customers urgently need. Economics 101 tells us that when demand is high and supply is low, prices should move higher. Translating this to the current steel market, many steel consumers refrained from buying over the past few months among an uncertain environment and diminished demand. They used existing inventories to fulfil orders, and refrained from restocking. This created an environment of depleted inventories, and the current price rally and extended lead times reveal these steel consumers attempt to restock in order to meet increased demand for their products. Elevated lead times should persist until this restocking is complete.
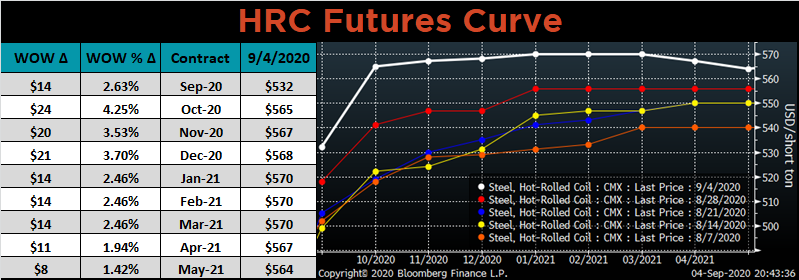
Turning to the futures market, an upward sloping curve (contango) like we saw over the past 3 months is a signal that the market is oversupplied. Conversely, a downward sloping curve (backwardation) signals that supply is tight. Last week, the curve shifted from a steep upward slope into a flat curve with all of 2021 trading within the same $5/st level. This change supports the insights from the PMI report, and additional shifts towards a downward sloping curve would signal increased price strength ahead.
The chart below shows the relationship between the Platts Midwest HRC index and the ISM Manufacturing PMI over the past 10 years.


The August ISM Manufacturing PMI and subindexes are below. The topline PMI number was up another 1.8 points to 56, the highest level since November of 2018.
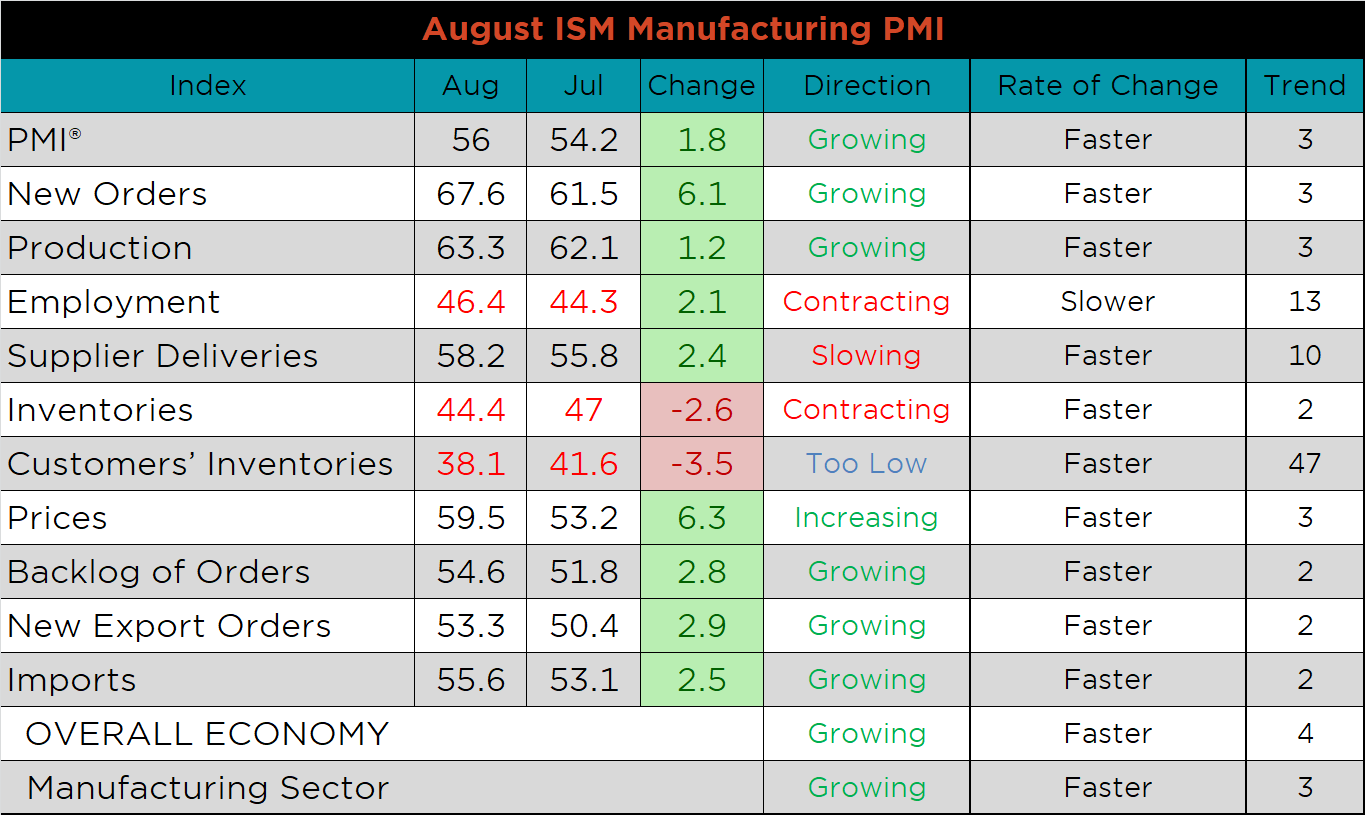
The chart below compares the ISM prices subindex with the ISM customer inventories subindex. The customer’s inventory subindex printed at its lowest level since January of 2014, while prices continue to climb. The second chart shows the new orders plus backlog subindex. The backlog and new orders were among the strongest compoenents again in August. The final chart shows the supplier deliveries subindex increasing for the first time in three months, indicating a tightening in shipping availability due to demand rather than supply chain constraints.


Most subindexes were higher MoM, led by prices and new orders. The inventory and customer inventory subindexes were lower and remain in contraction, along with the employment subindex.


August’s global PMI printings show 18 of the 25 watched countries’ PMIs increasing MoM. PMIs in the U.S., China (Caixan), Germany and Japan increased, while the Eurozone and China (Official) PMIs were slightly lower. Japan is the largest economy still in contraction, printing at 47.2.
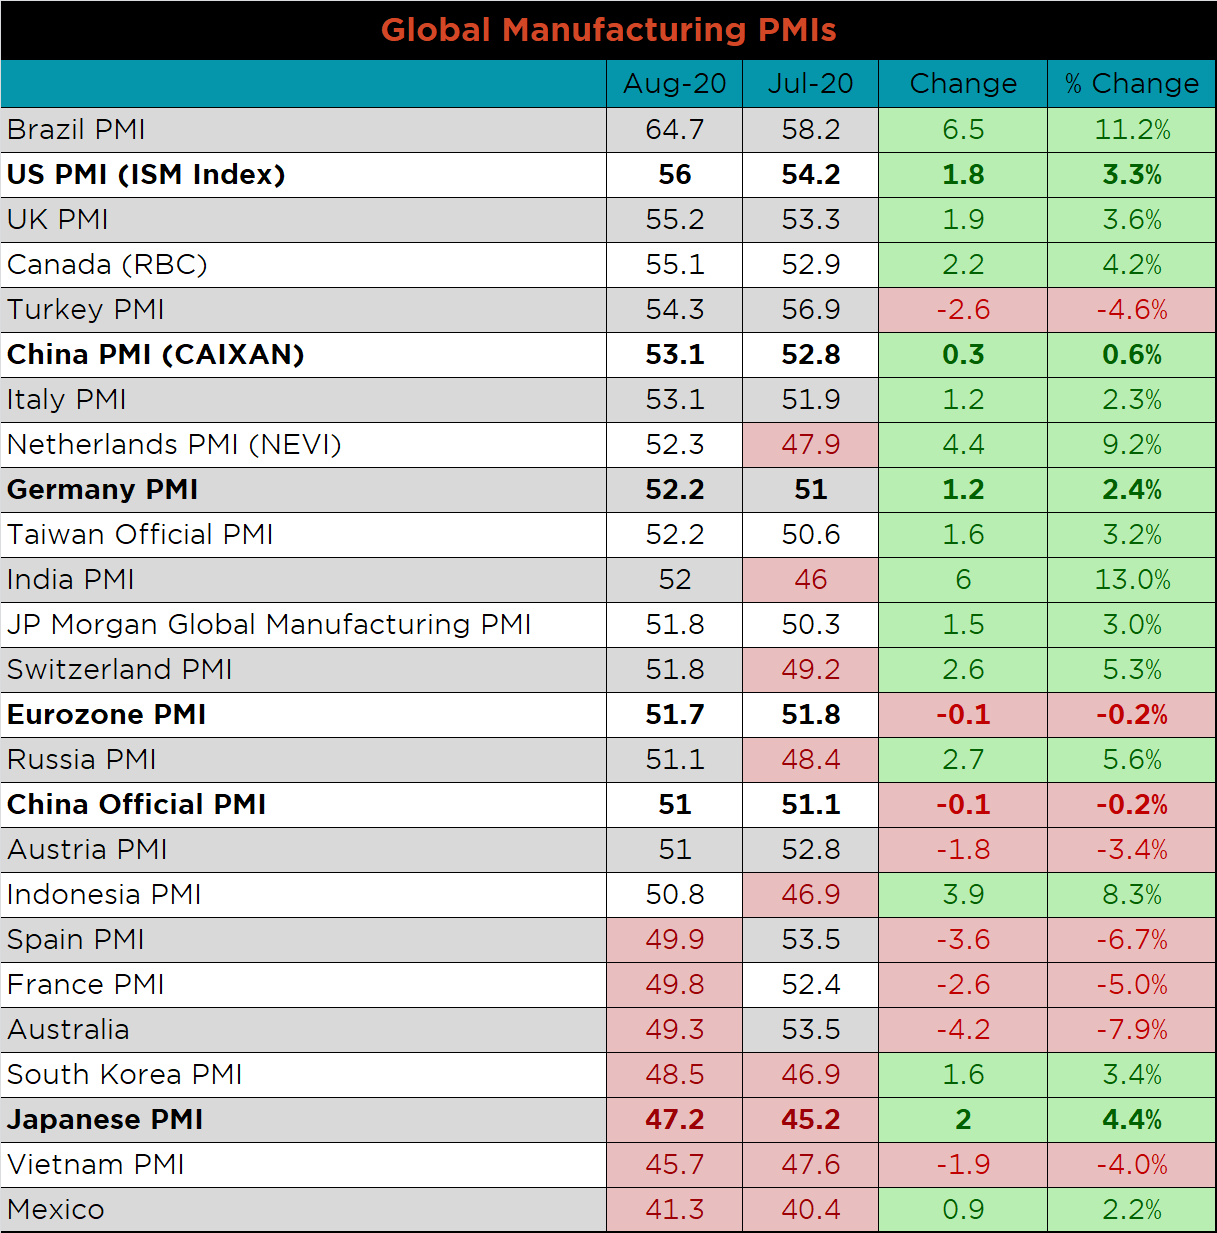


China’s official PMI printed slightly lower, while the Caixan Manufacturing PMI printed higher. Both remain in expansion.

The table below breaks down China’s official manufacturing PMI subindexes. New export orders saw the largest increase again in August, but remain in contraction.


July seasonally adjusted U.S. construction spending was up 0.1% compared to June, but 0.1% lower than July 2019.

The white line in the chart below represents construction spending in 2020 and compares it to the spending of the previous 4 years. Overall, spending levels in July were slightly higher than in June, but dropped below last year’s level. The last two charts show the YoY changes in construction spending. Private non-residential spending decreased for the fourth month in a row. Residential spending has been essentially even with last year’s high spending levels.


August U.S. light vehicle sales increased further to a 15.2m seasonally adjusted annualized rate (S.A.A.R). The second chart shows the relationship between the unemployment rate and auto sales. The unemployment rate is inverted to show that declining unemployment typically leads to increasing auto sales. Both continued to improve in August, but auto sales outpace the unemployment rate in their respective rebounds.


Below are the most pertinent upside and downside price risks:
Upside Risks:
Downside Risks:

The Platts TSI Daily Midwest HRC Index jumped significantly, up $46 to $540.50.

The CME Midwest HRC futures curve is below with last Friday’s settlements in white. The entire curve shifted higher, most significantly in Q4 of 2020, creating a very flat curve.
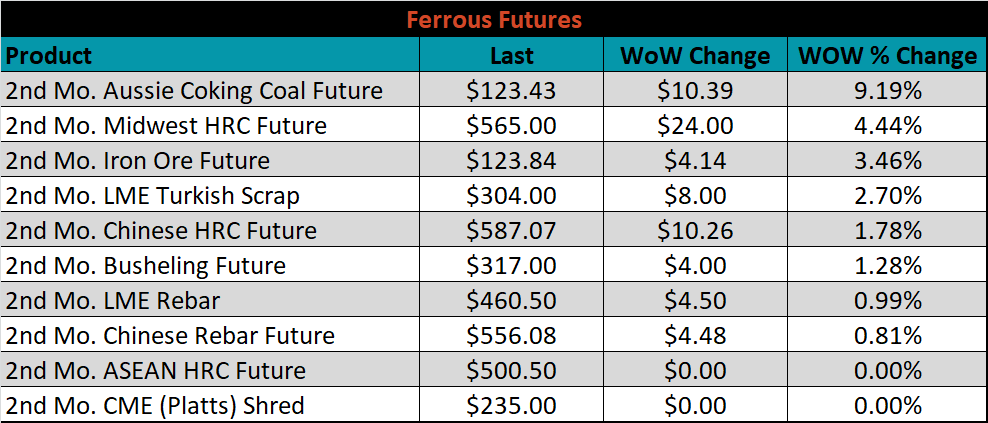
October ferrous futures were mostly higher, led by Aussie coking coal, which rose 9.2%.
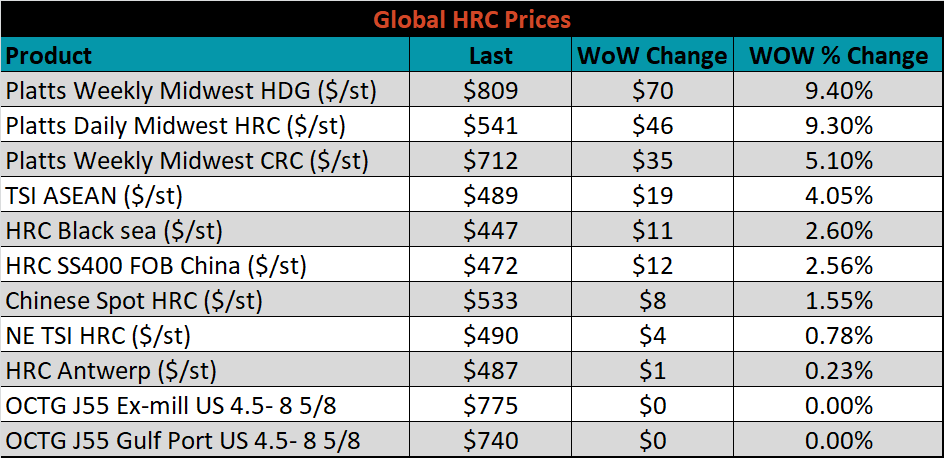
The global flat rolled indexes were higher, led by TSI Midwest HDG, up 9.4%.
The AISI Capacity Utilization Rate was down 1.3% to 61.7%. This was the first decrease since the first week of June. The longer production and utilization rate remain low, the more upside in the current price rally.


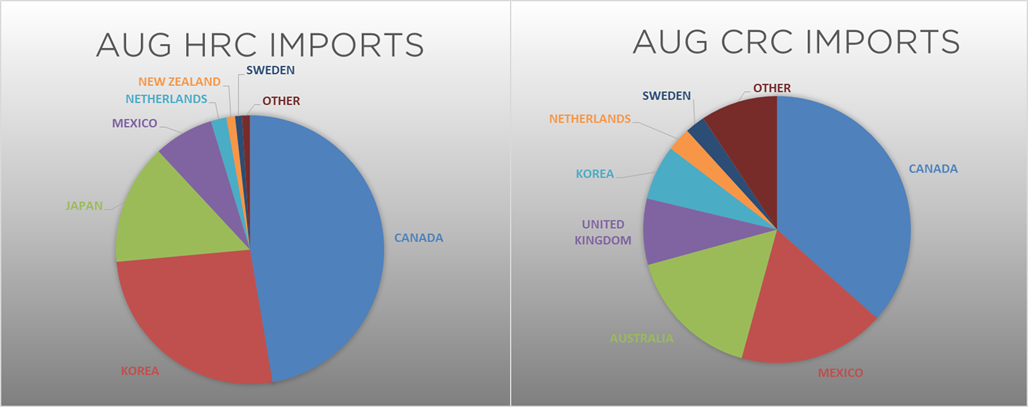
August flat rolled import license data is forecasting a decrease of 97k to 565k MoM.

Tube imports license data is forecasting no change in August.


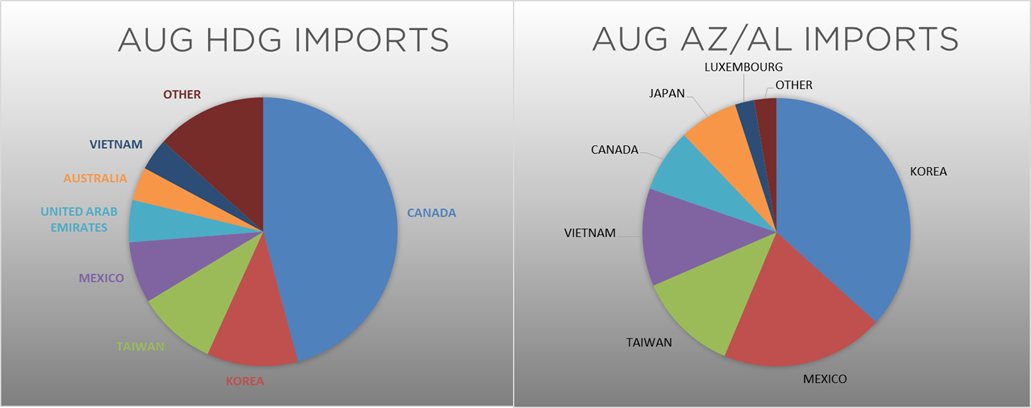
August AZ/AL import license data is forecasting a 4k increase to 60k.

Below is July import license data through September 1, 2020.


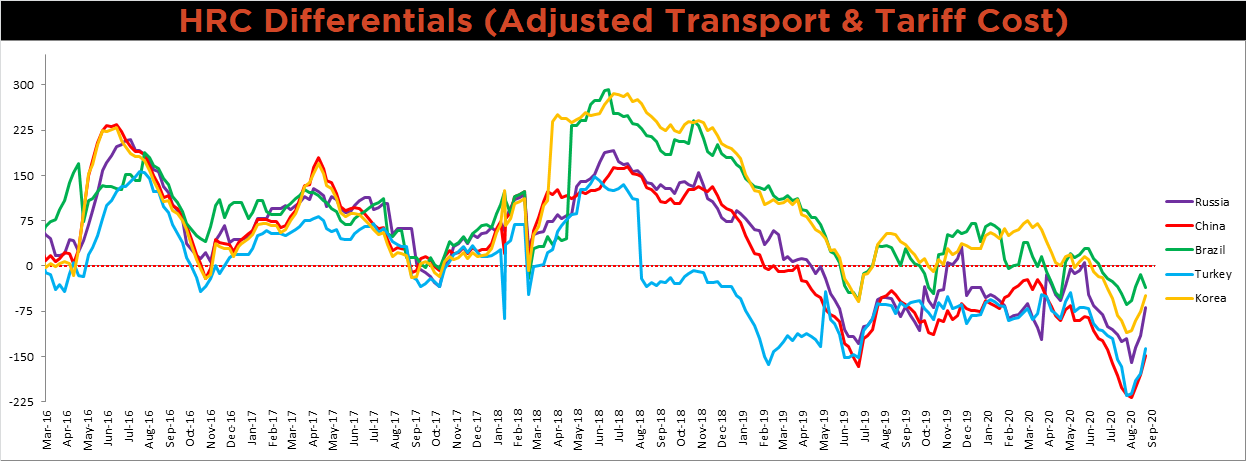
Below is the Midwest HRC price vs. each listed country’s export price using pricing from SBB Platts. We have adjusted each export price to include any tariff or transportation cost to get a comparable delivered price. This week, the Brazilian differential decreased, after the Trump administration reduced their import quota for the remainder of the year, subjecting additional imports to a 25% tariff. For all other countries, differentials increased again the U.S. price continues to increase dramatically.
SBB Platt’s HRC, CRC and HDG pricing is below. The Midwest HDG, HRC and CRC prices were up, 9.4%, 9.3% and 5.1%, respectively. Globally, the Mexican HRC and East Asian Import CRC prices were up, 13.5% and 11.6%, respectively.


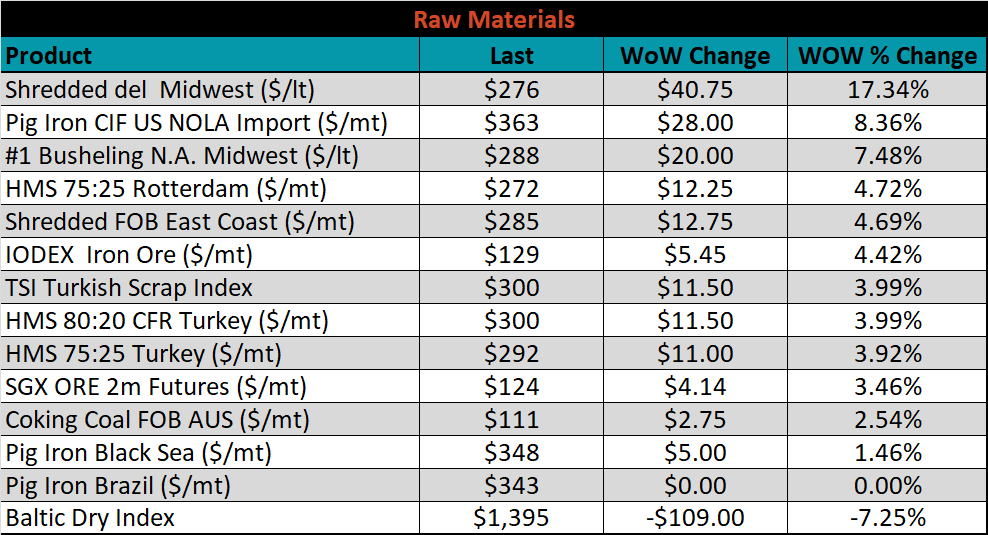
Raw material prices were higher. Midwest shred was up 17.3%, while the Baltic Dry index was down 7.3%.
Below is the iron ore future curve with Friday’s settlements in orange, and the prior week’s settlements in green. Last week, the front of the curve shifted higher.

The ex-flat rolled prices are listed below.


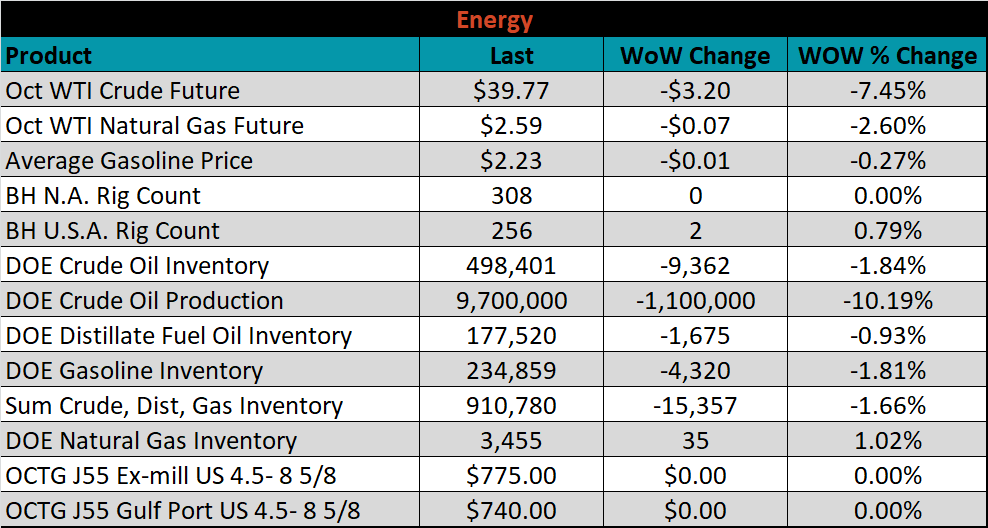
Last week, the October WTI crude oil future lost $3.20 or 7.5% to $39.77/bbl. The aggregate inventory level was down another 1.7%, while crude oil production was down 1.1m to 9.7m bbl/day. The Baker Hughes North American rig count was flat, while the U.S. rig count was up two rigs.


The list below details some upside and downside risks relevant to the steel industry. The orange ones are occurring or look to be highly likely. The upside risks look to be in control.
Upside Risks:
Downside Risks: