Content
-
Weekly Highlights
- Market Commentary
- ISM PMI
- Global PMI
- Construction Spending
- Auto Sales
- Risks


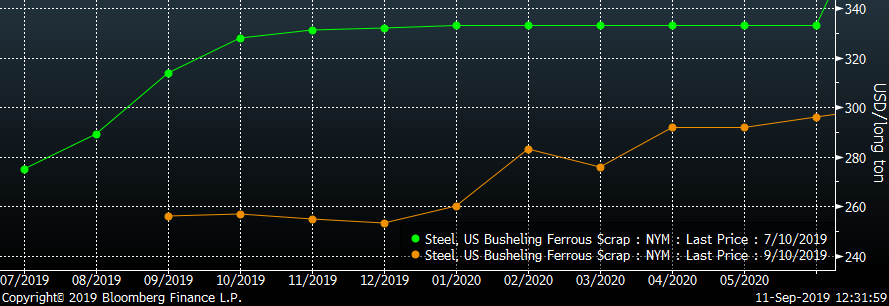
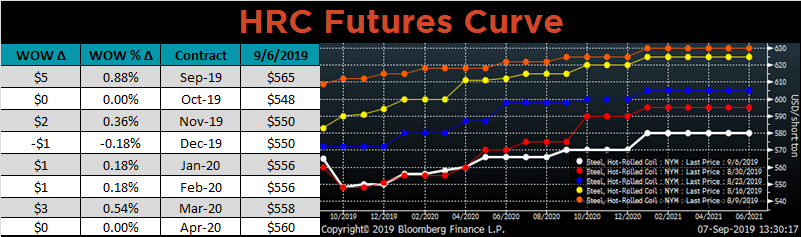
Sentiment within the domestic steel market has reversed drastically from two months ago, primarily driven by a reversal of the short-lived rally in scrap pricing. The expectation for scrap pricing in July, based on the Busheling futures curve, was for prices to rally over $50 to $330/lt by October. However, after a down $40/lt drop in September, the current expectation for October pricing is near $250/lt for #1 Midwest Busheling. The below chart shows the current futures curve in orange, and the futures curve from July 10th in green.
The strength in scrap pricing during the summer allowed mills to push three price increases, of which they were able to capture a significant portion. Moreover, the expectations for scrap prices to continue increasing created rumors of more price increase announcements. These did not materialize, and scrap pricing today is below those levels in June. While domestic steel prices have declined, they are still well above late June pricing, especially for tandem products. With both iron ore and scrap pricing lower now, BOF and EAF’s profitability remains stable, and it is at higher levels than their midsummer bottom.
This dynamic does leave more room for buyers to negotiate pricing, especially for large orders, as mills attempt to fill out order books into the end of the year. However, order books do appear to be strong at the moment, and lead times have held steady since they extended in the late summer. Additionally, look for mini-mills to be more open to negotiating price because of the recent declines in scrap pricing. The competitive landscape among domestic producers changed with the decline of imports created by the Section 232 tariffs. Mills are looking to gain market share by filling the gap created by the tariffs, and have pushed ahead with plans to expand domestic production capability. The main tool to capture this market share is through price negotiation, and scrap pricing outlook gives EAF’s an advantage in the near term.
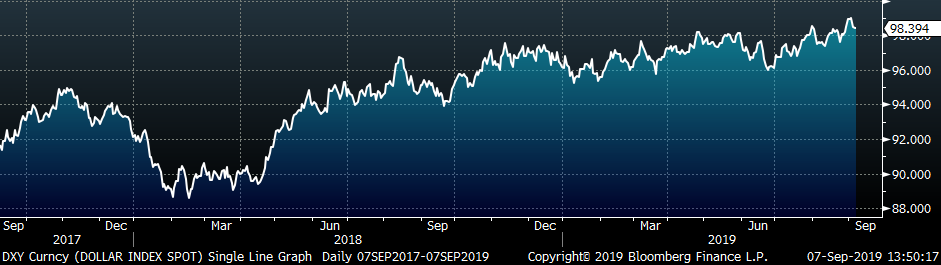
This dynamic will benefit steel buyers, who remain skeptical in an environment of poor global manufacturing sentiment (below) and declining futures prices. However, this also presents an opportunity to secure long term pricing at attractive levels. Future pricing for 2020 is at the lowest levels in years, and we would suggest steel consumers remove this volatility from their businesses with the futures curve.
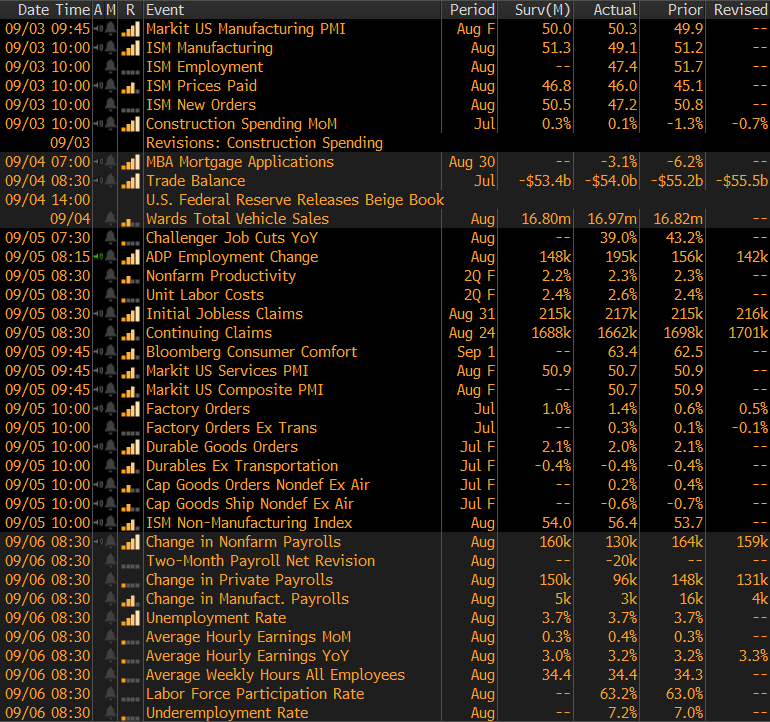
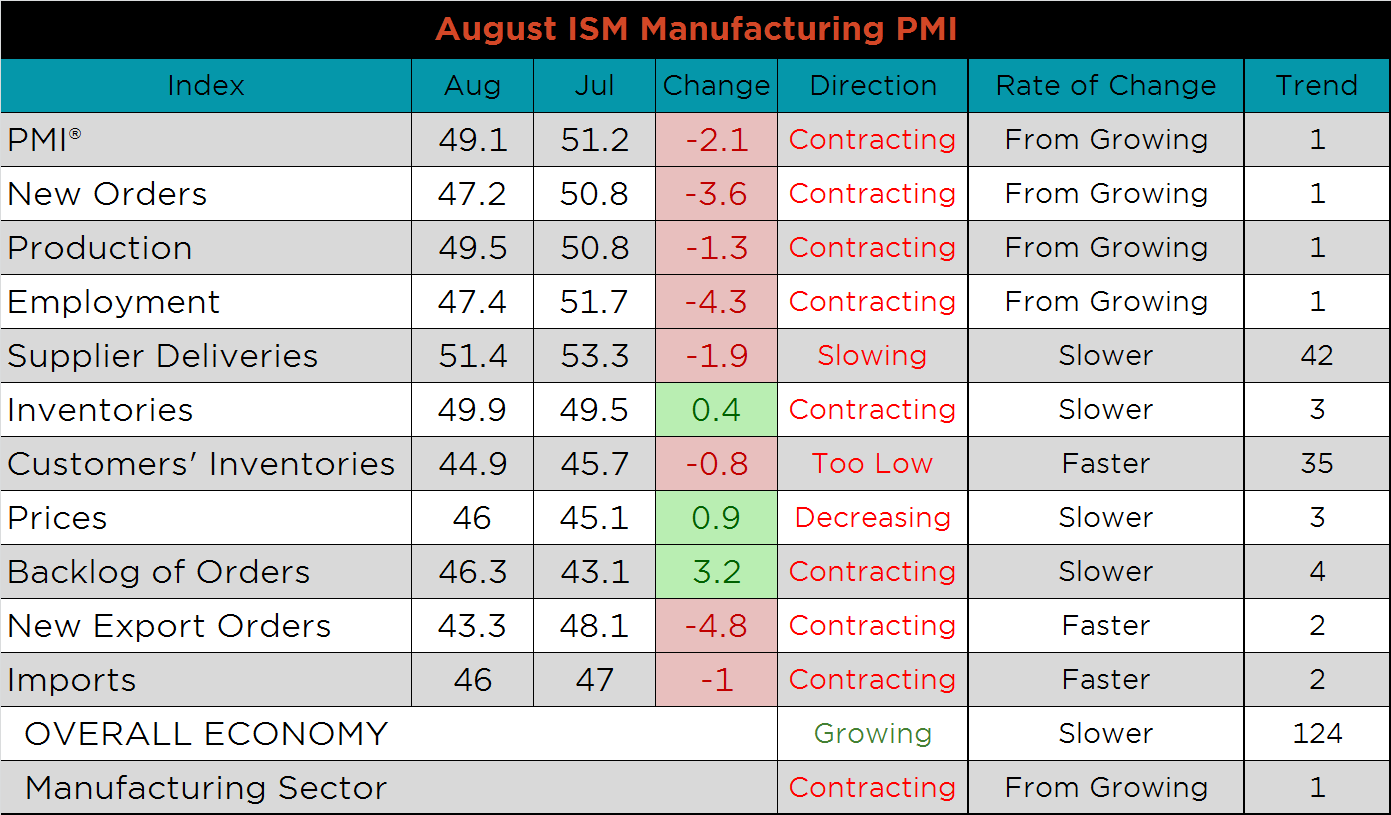
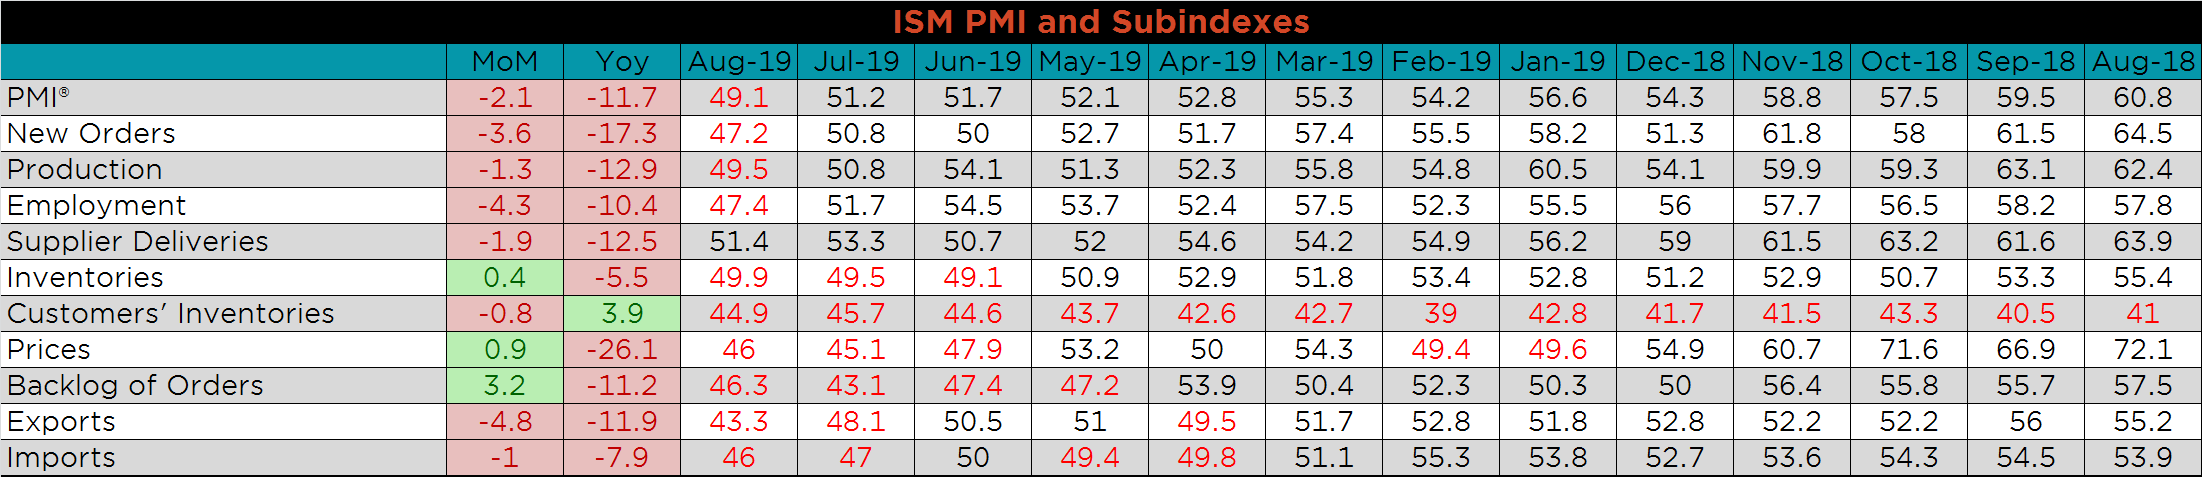
The August ISM Manufacturing PMI and subindexes are below. The sharp decline in the manufacturing index is the first contraction print since August 2016, and the lowest since January 2016. The only subindex still printing in expansion was supplier deliveries. New export orders, employment and new orders slowed the most, down 4.8, 4.3 and 3.6 points, respectively.
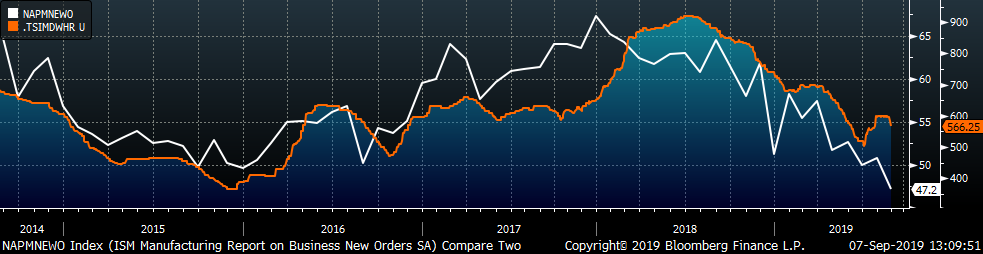
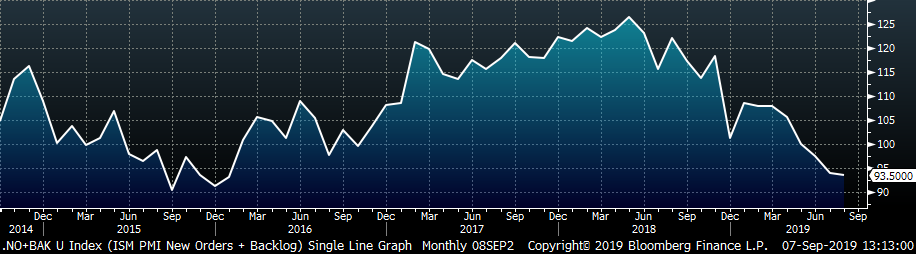
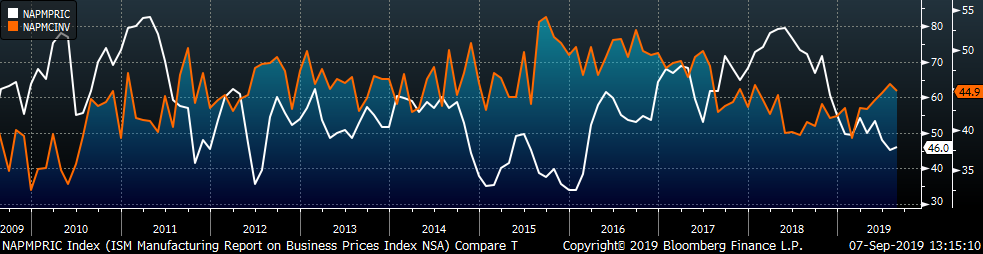
The chart below compares the ISM new orders subindex with the Platts TSI Daily Midwest HRC Index. The subindex printed at the lowest level since June 2012. The second chart adds the new orders and backlog subindexes together, giving a gauge of manufacturing demand, which continued to weaken further in August. Finally, the third chart shows the prices subindex and the customer inventories. The decrease in customer inventories, as well as new orders and backlog, suggest high sensitivity to the uptick in price.
The only subindex still printing in expansion was supplier deliveries. New export orders, employment and new orders slowed the most, 4.8, 4.3 and 3.6 points, respectively.
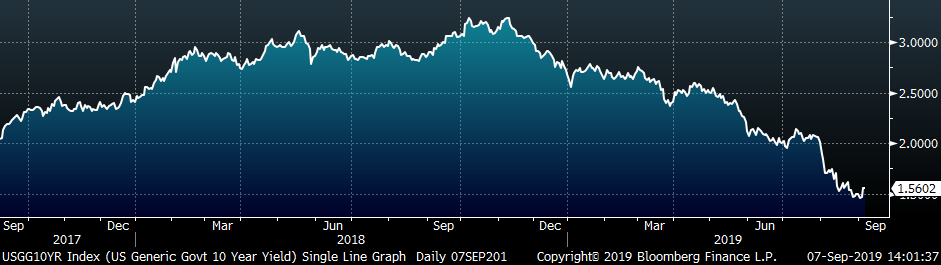
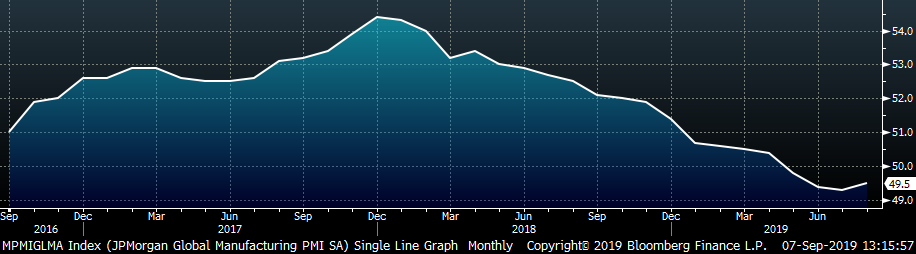
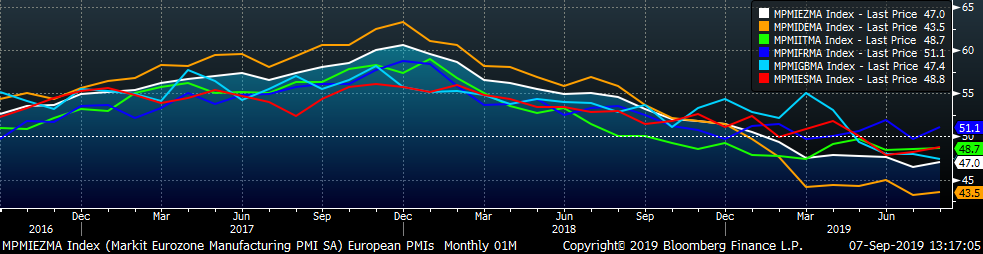
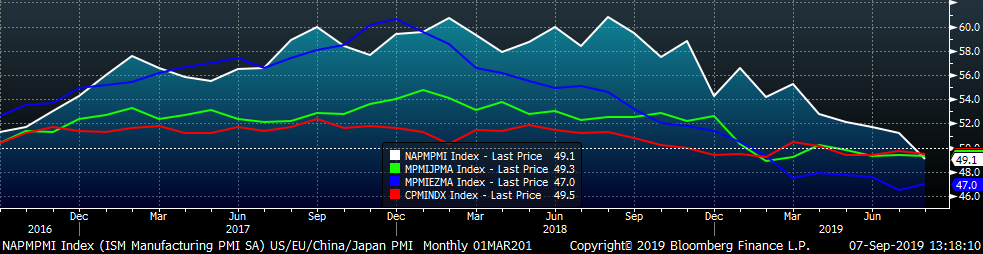
This month’s global PMI printings confirmed fears of a global slowdown in manufacturing. However, bright spots include Brazil, France and China’s Caixan PMI’s which all moved into expansion and join Australia, the Netherlands, India and Vietnam. The U.S. and Canada both printed into contraction and join the 16 other countries identified below, most notably, Japan, China (Official), the Eurozone and Germany.
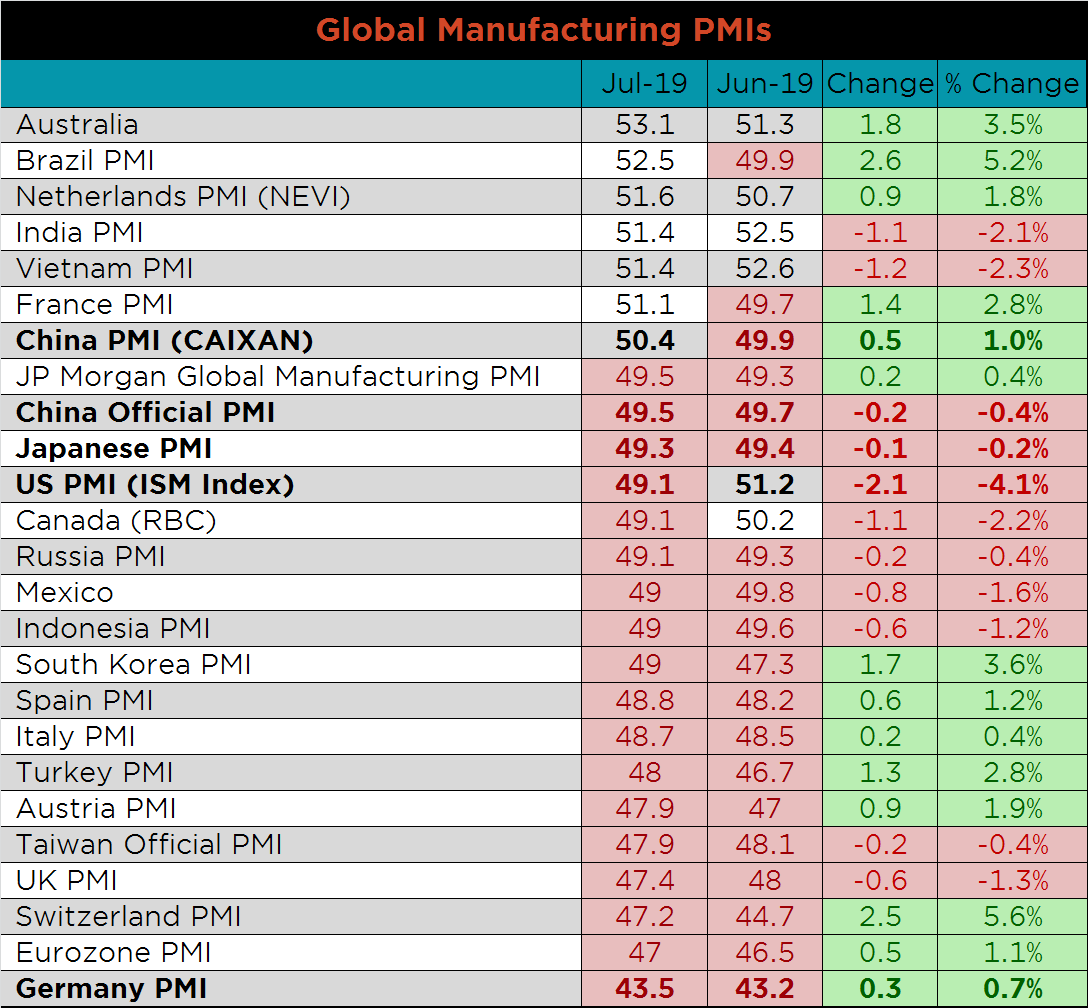
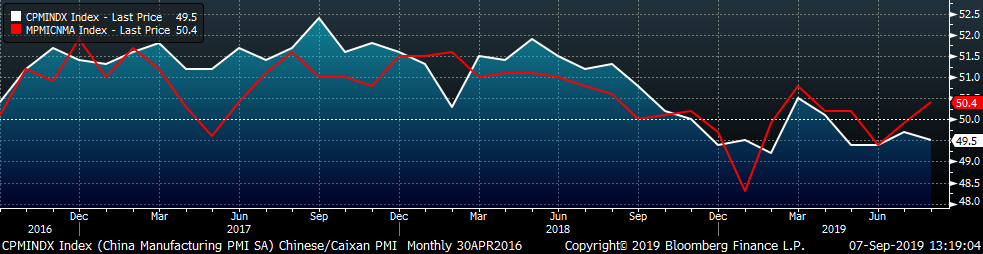
China’s official PMI printed down to 49.5, while the Caixan Manufacturing PMI printed one point higher and in expansion at 50.4.
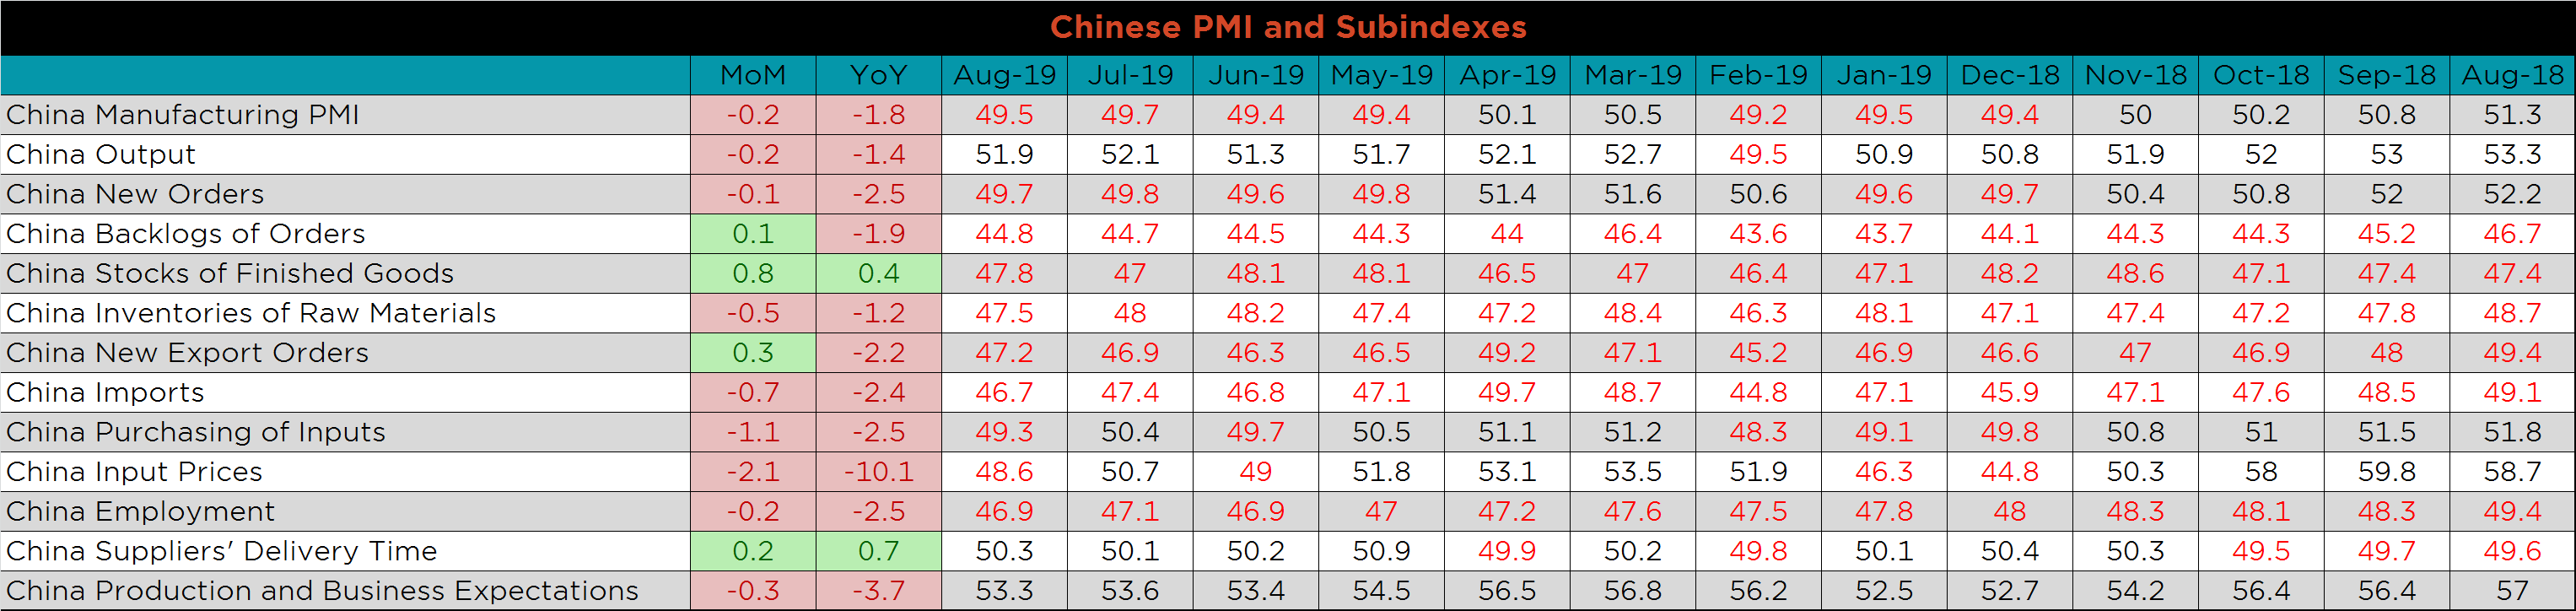
The table below breaks down China’s official manufacturing PMI subindexes. While new export orders and the backlog of orders remain in contraction, they both printed higher MoM. The only subindexes still printing in expansion are output, delivery time and production & business expectations.
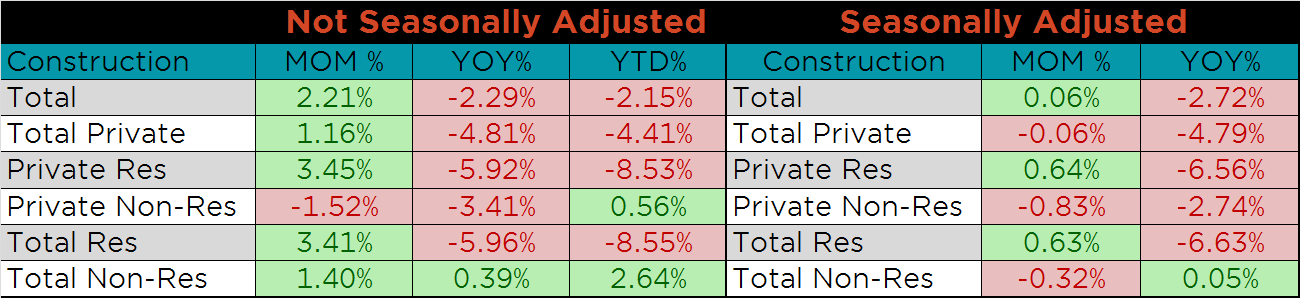
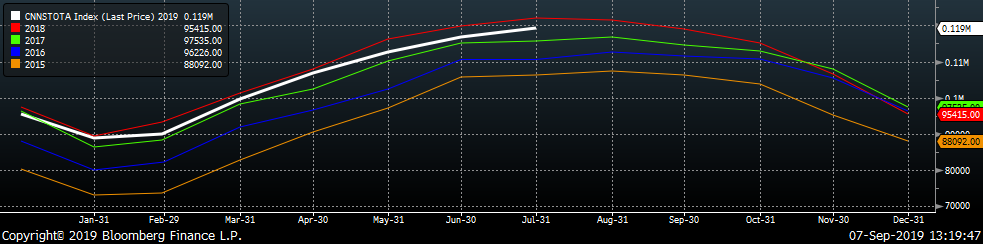
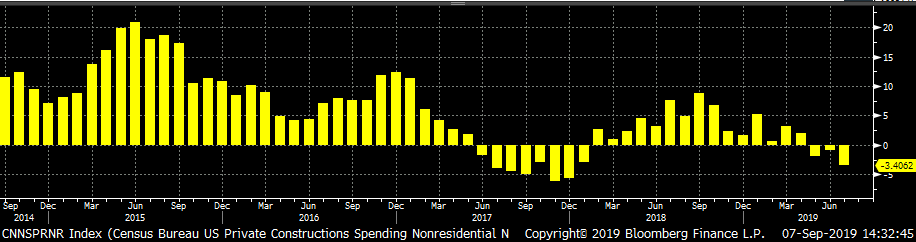
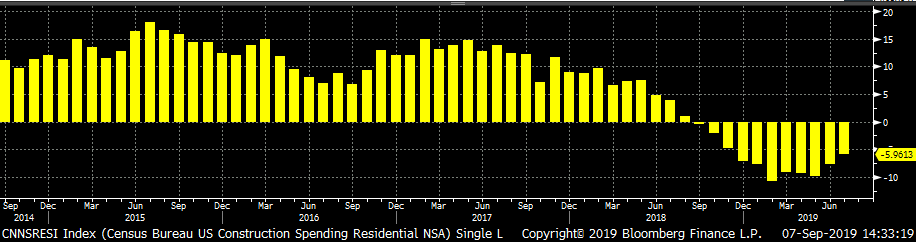
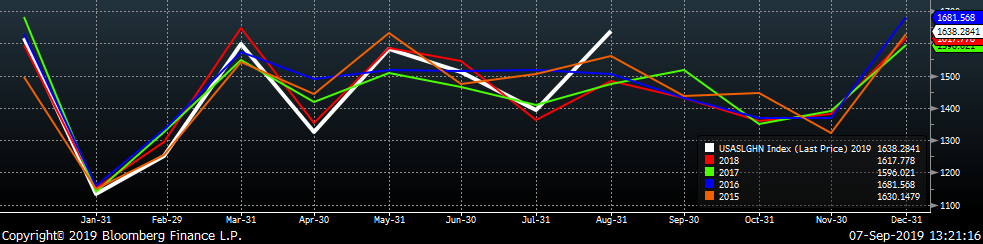
July seasonally adjusted U.S. construction spending was slightly higher MoM, but 2.7% lower YoY. While SA spending is below 2018 elevated levels for nearly all of the categories, 2019 spending levels are still the second highest on record. Nonresidential spending, not seasonally adjusted, remains strong and is higher MoM, YoY and YTD. Residential spending appears to be recovering from the low levels earlier in the year.
The white line in the chart below represents construction spending in each month of 2019 and compares it to the spending of the previous 4 years.
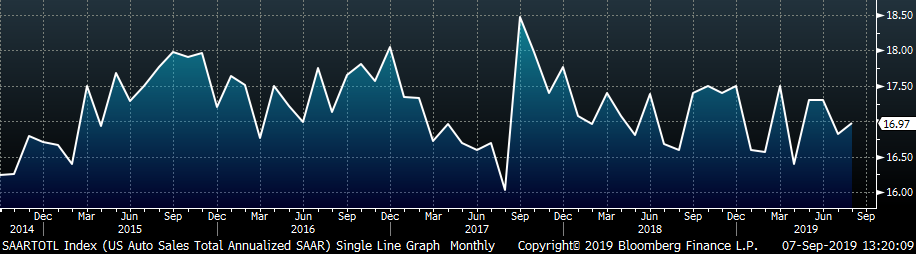
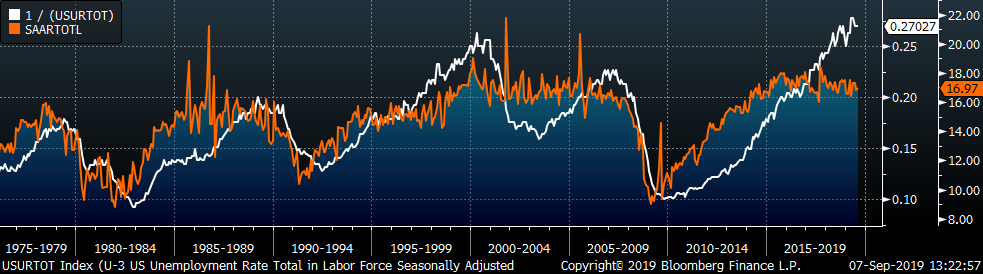
August U.S. light vehicle sales were up 170k to a 16.97m seasonally adjusted annualized rate (S.A.A.R). The white line in the second chart compares monthly auto sales with previous year’s levels. The first 7 months of 2019 have been in line with sales of the previous 4 years. However, August sales were 2.2% above last year’s levels. The final chart shows the historical relationship between unemployment and auto sales. The unemployment rate is inverted to show that declining unemployment typically leads to increasing auto sales.
Below are the most pertinent upside and downside price risks:
Upside Risks:
Downside Risks:
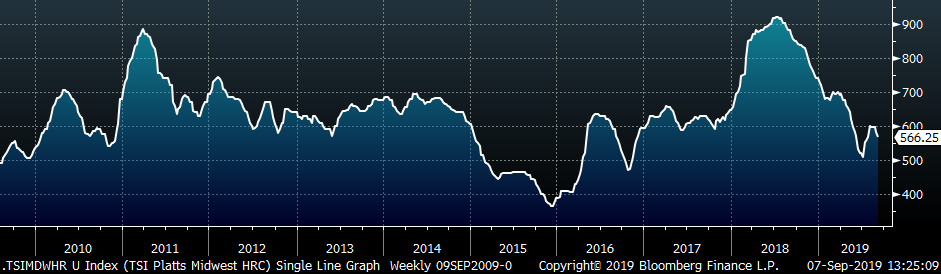
The Platts TSI Daily Midwest HRC Index was down $15.50 to $566.25.
The CME Midwest HRC futures curve is below with last Friday’s settlements in white. The front of the curve was unchanged, while the back of the curve shifted lower.
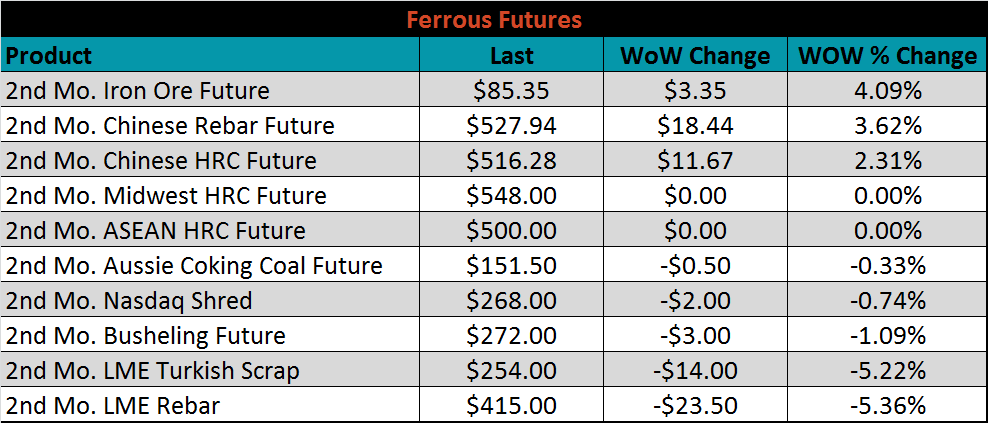
October ferrous futures were mixed. Iron ore futures gained 4.1%, while rebar lost 5.4%.
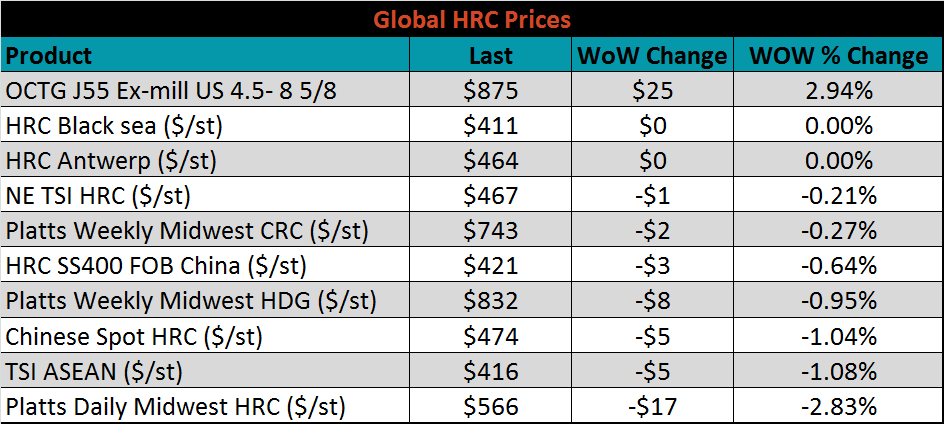
The global flat rolled indexes were mixed. OCTG J55 tubing was up 3.1%, while TSI Midwest HRC was down 2.8%.
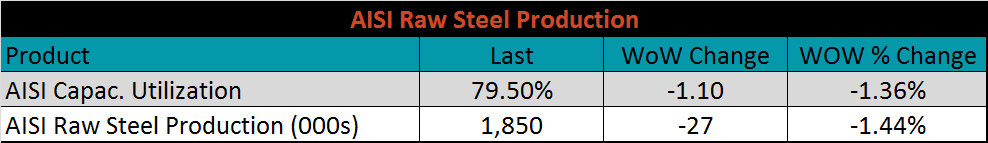
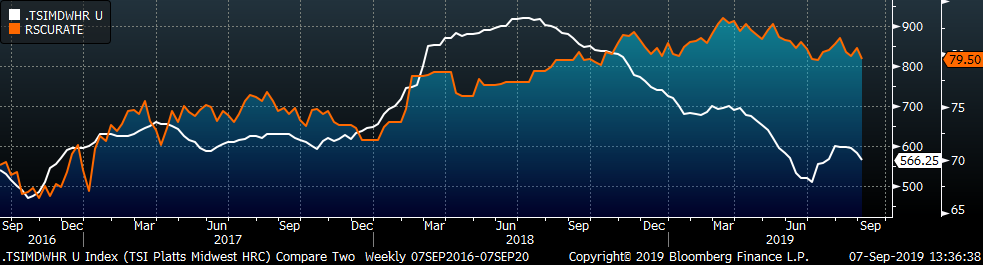
The AISI Capacity Utilization Rate was down 1.1% to 79.5%, and below the 80% goal set by the Trump administration since October. Recent domestic price softness provides an interesting backdrop for future production with upcoming maintenance outages planned.
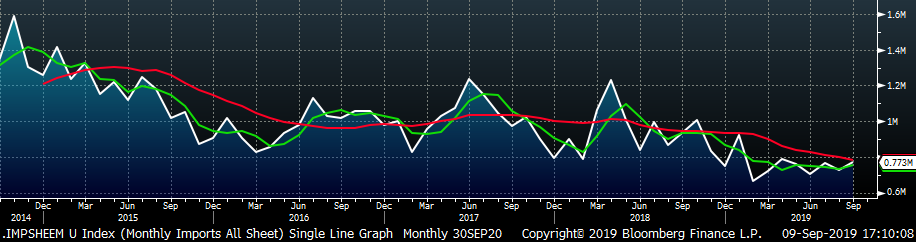
September flat rolled import license data is forecasting an increase of 48k to 773k MoM.
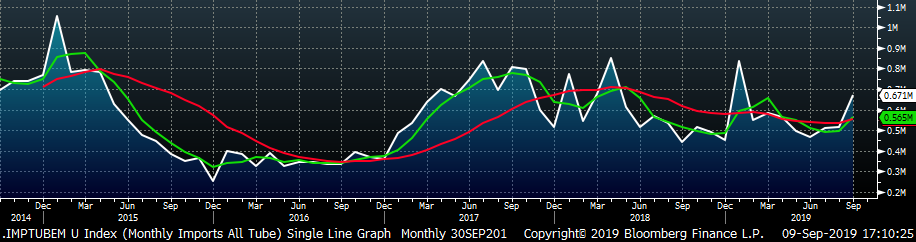
Tube imports license data is forecasting a MoM increase of 179k to 671k tons in September.
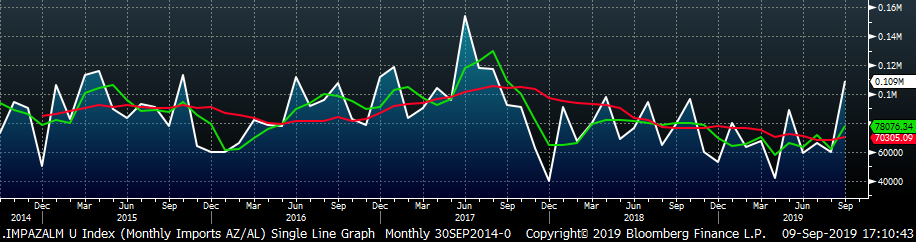
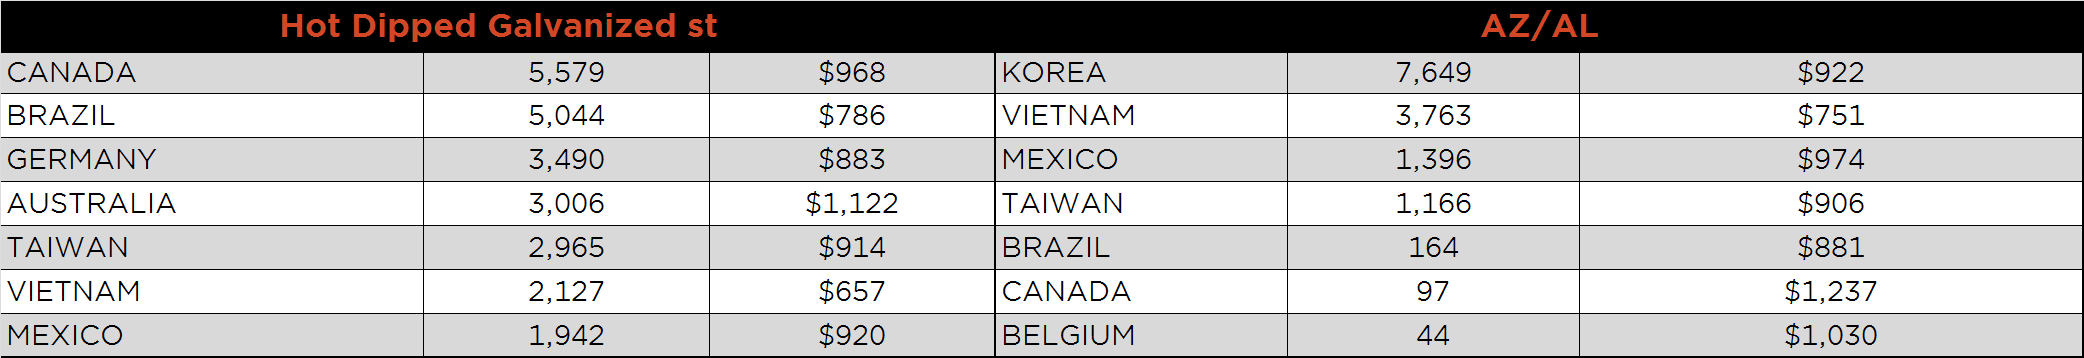
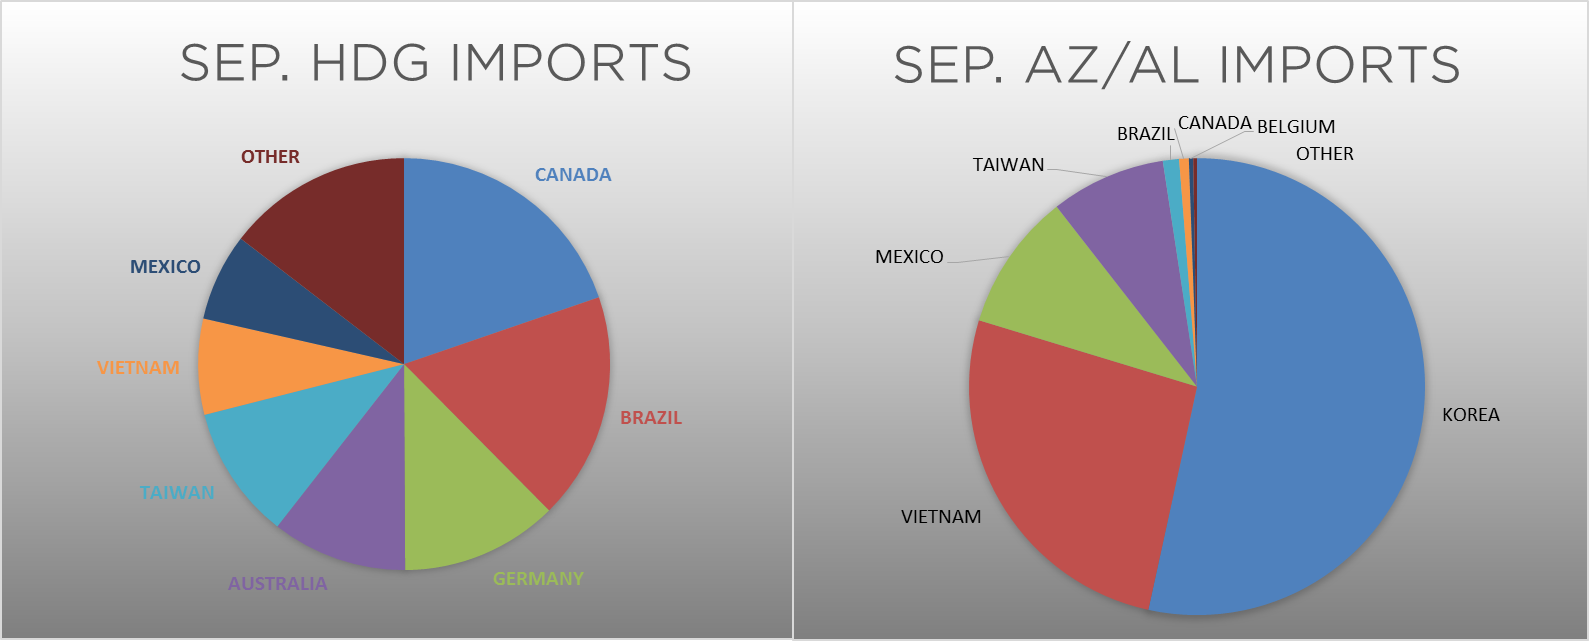
AZ/AL import license data is forecasting an increase of 49k in September to 109k.
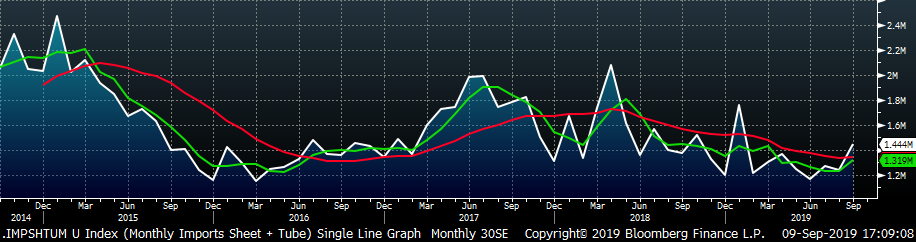
Below is August import license data through September 3, 2019.
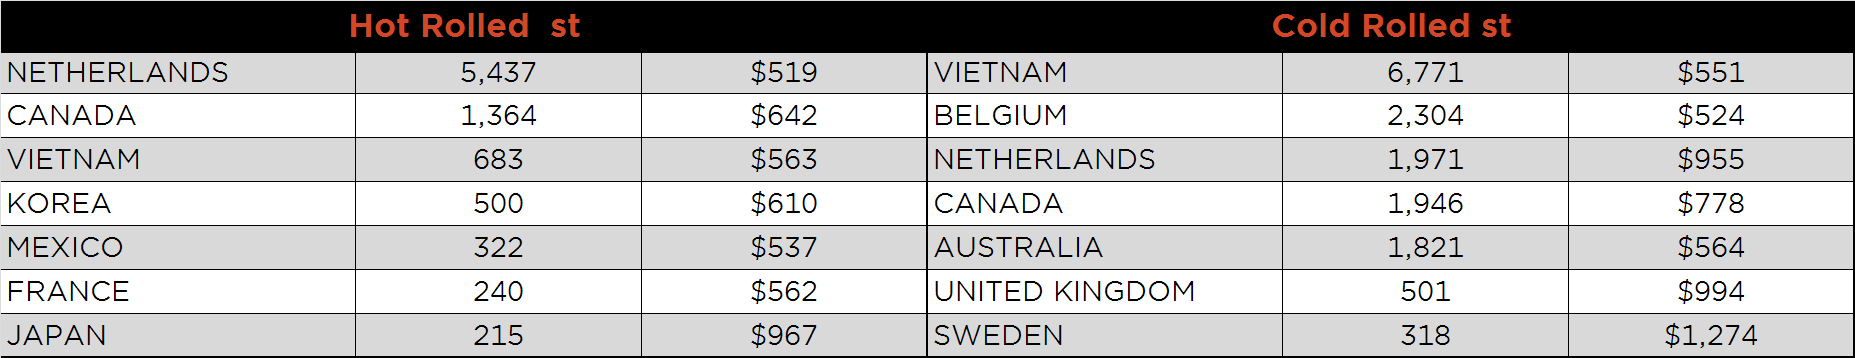
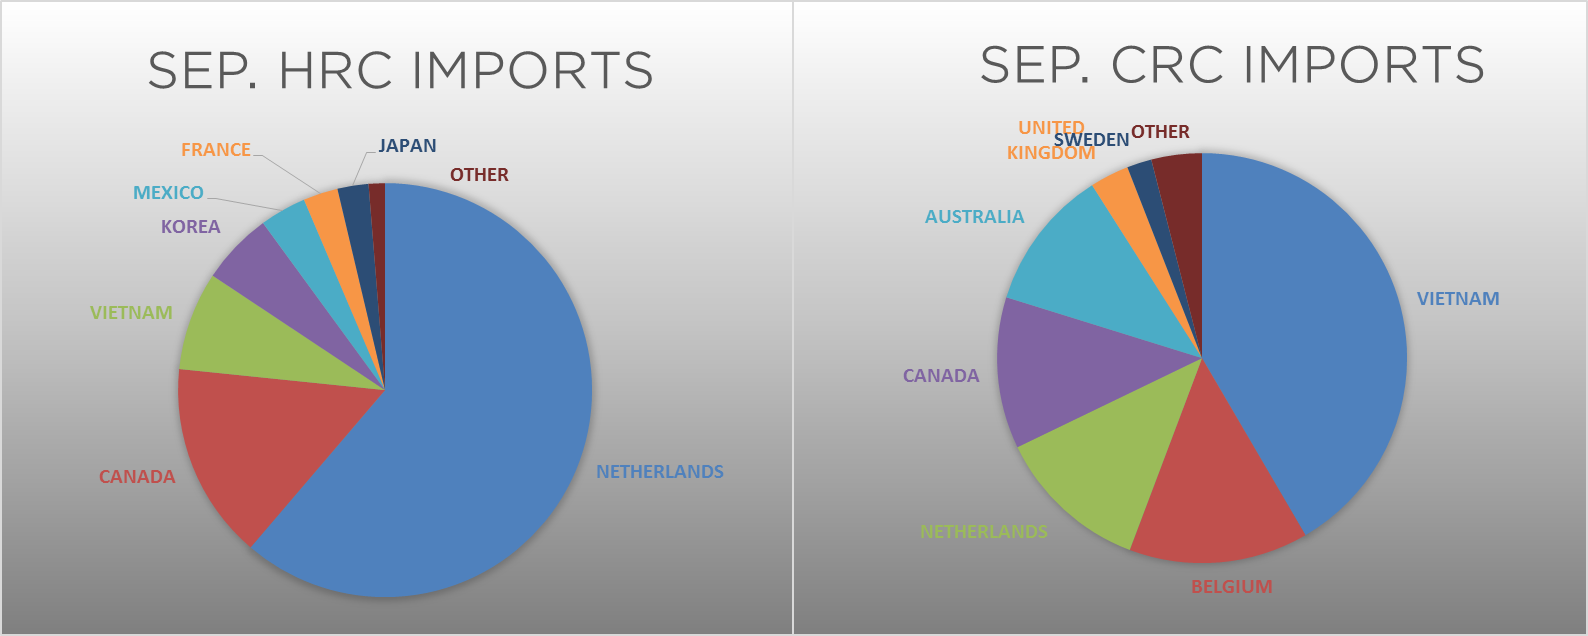
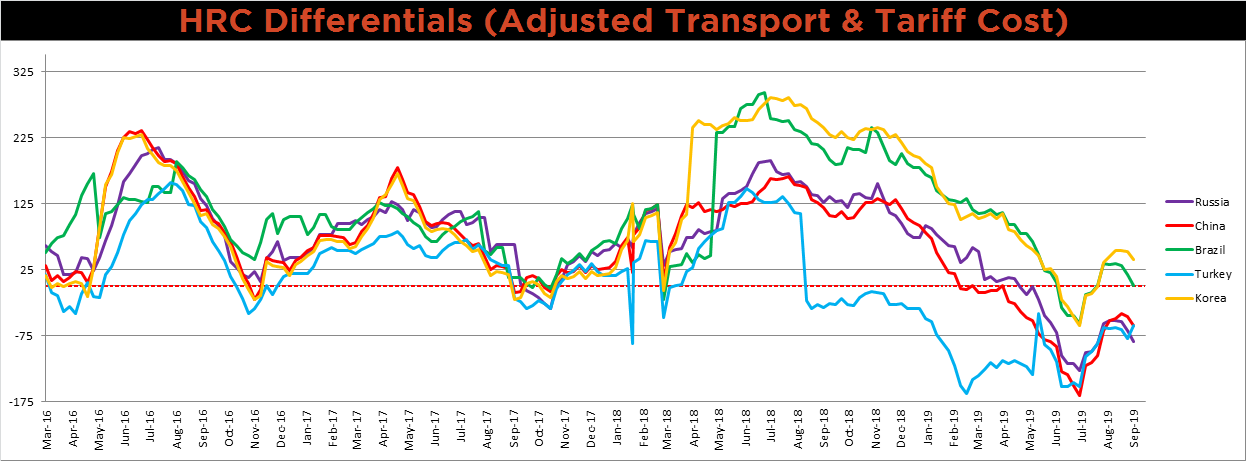
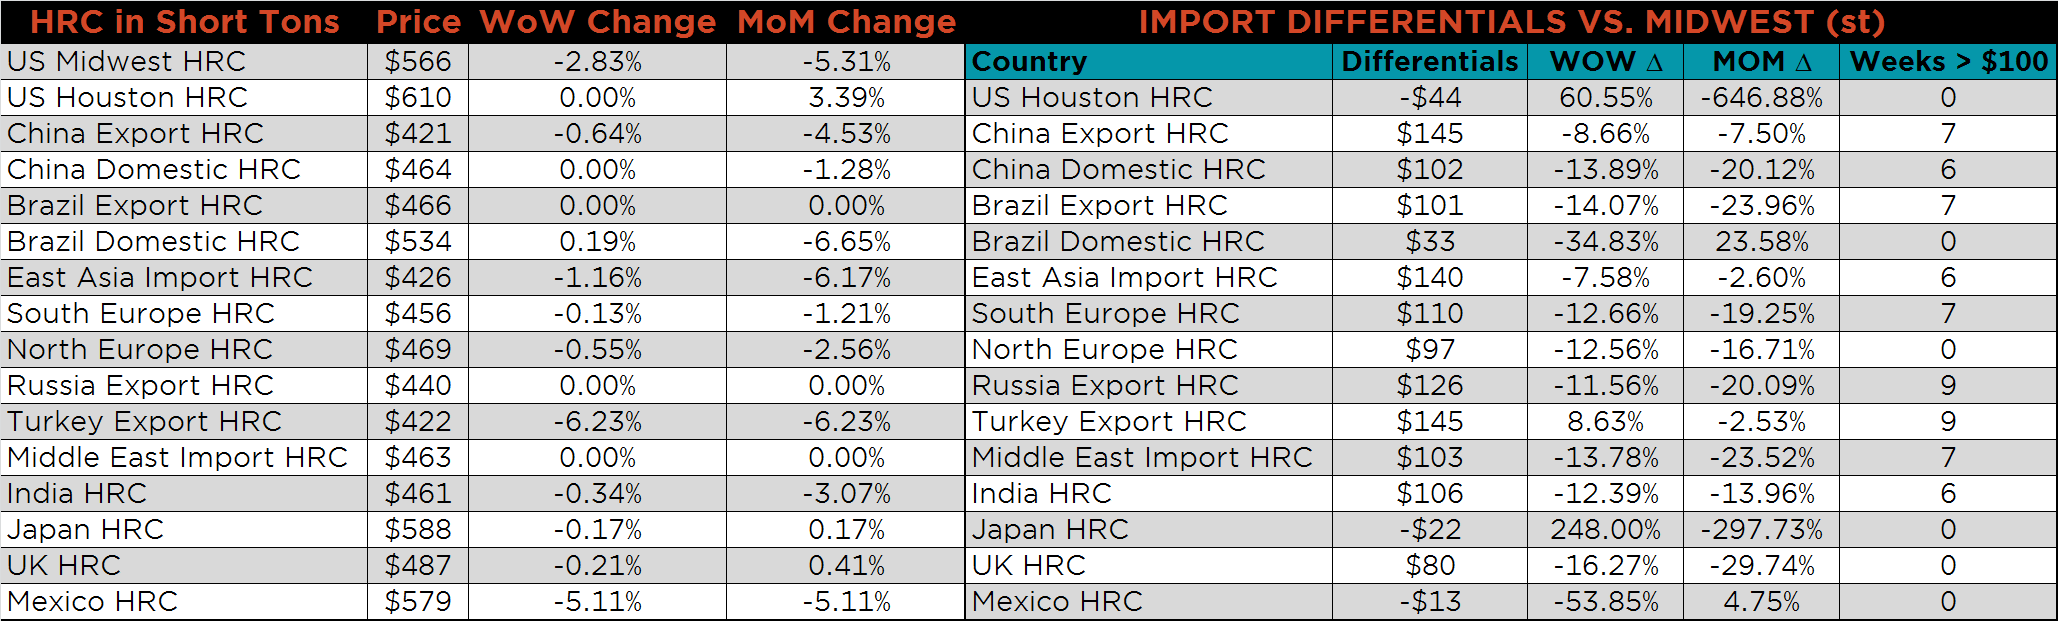
Below is the Midwest HRC price vs. each listed country’s export price using pricing from SBB Platts. We have adjusted each export price to include any tariff or transportation cost to get a comparable delivered price. The Midwest HRC price has continued to decline over the previous four weeks. Turkish export prices were significantly lower, while the remaining global prices have remained stable.
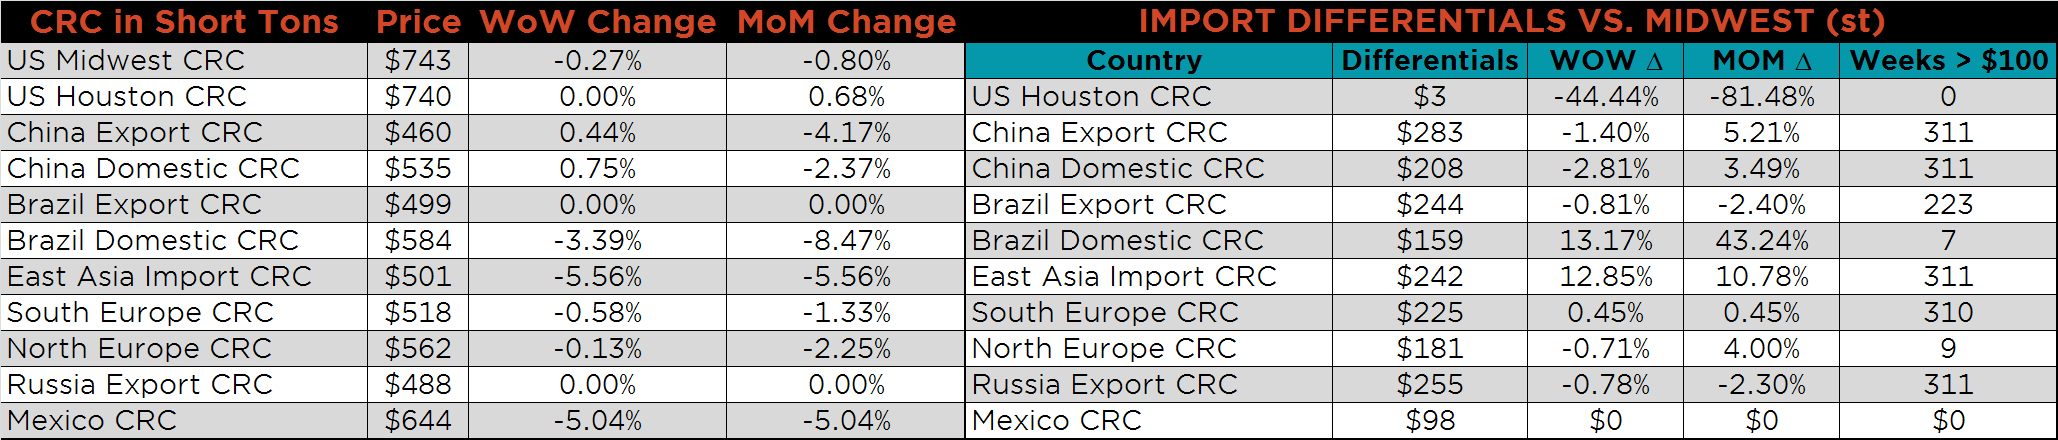
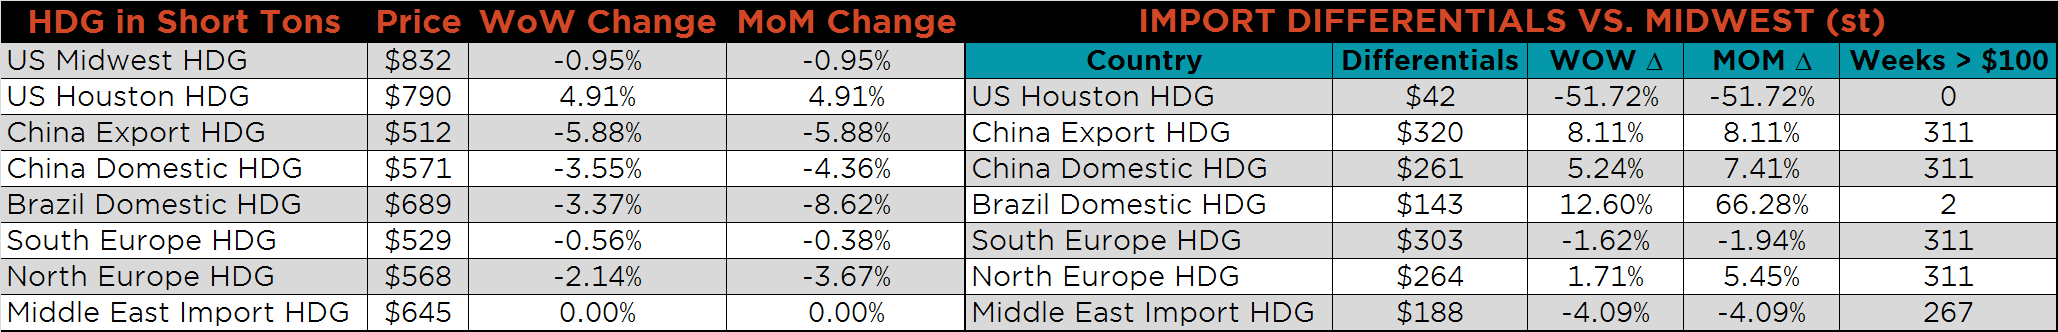
SBB Platt’s HRC, CRC and HDG pricing is below. The Midwest HRC, HDG and CRC prices were down on the week 2.8%, 1% and 0.3%, respectively. The Turkish HRC and Chinese HDG prices were both lower 6.2% and 5.9%, respectively.
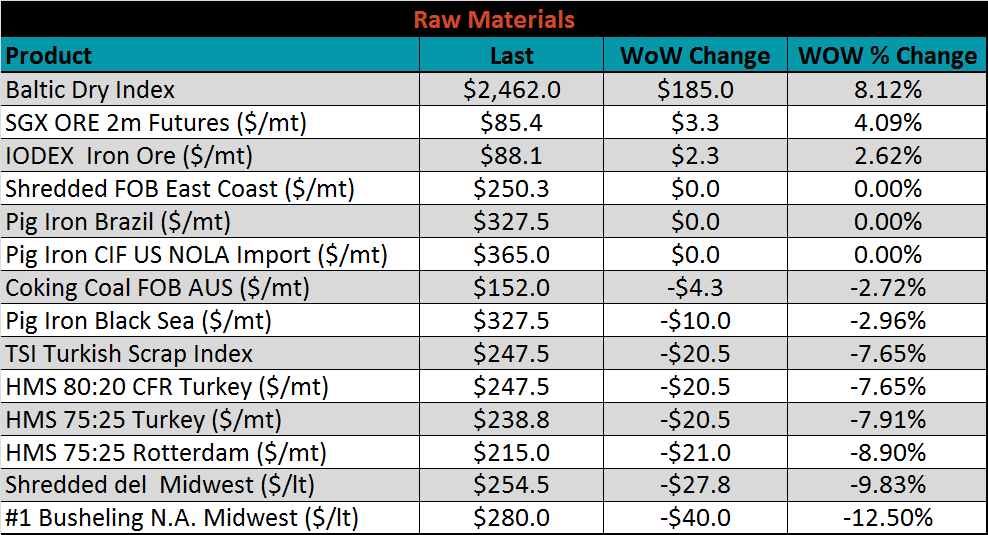
Raw material prices were mostly lower. #1 Busheling was down 12.5%, while SGX iron ore futures were up 4.1%.
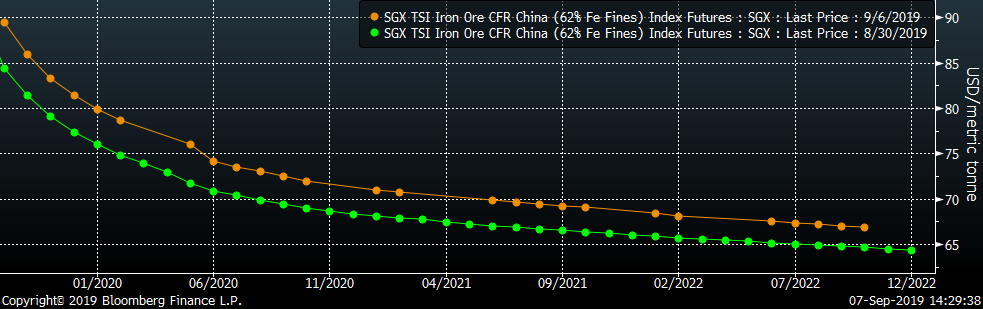
Below is the iron ore future curve with Friday’s settlments in orange, and the prior week’s settlements in green; the entire curve shifted higher.
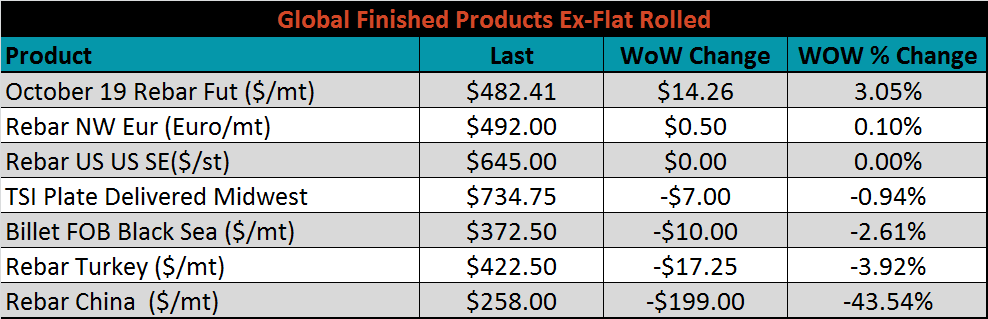
The ex-flat rolled prices are listed below.

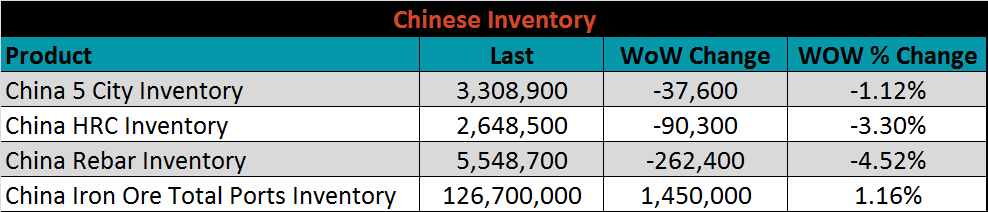
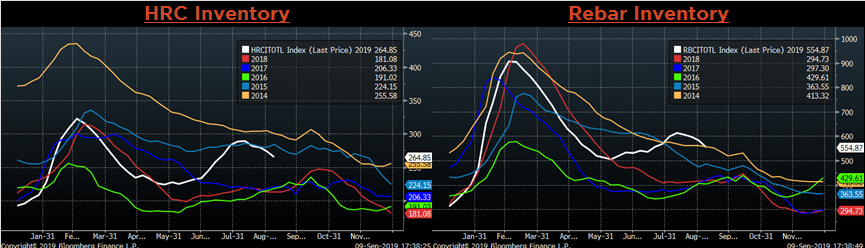
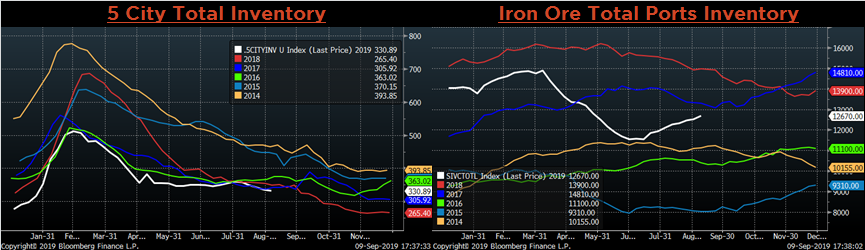
Below are inventory levels for Chinese finished steel products and iron ore. HRC, Rebar and 5-City inventory levels were lower again, while Iron Ore port inventory has continued to increase. Another month of poor manufacturing data suggests that the trend of destocking finished products will likely continue.
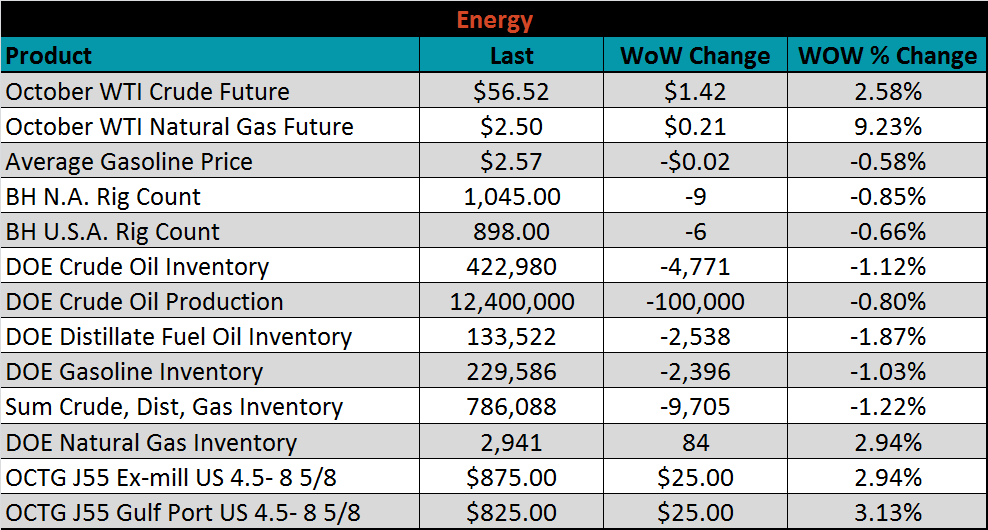
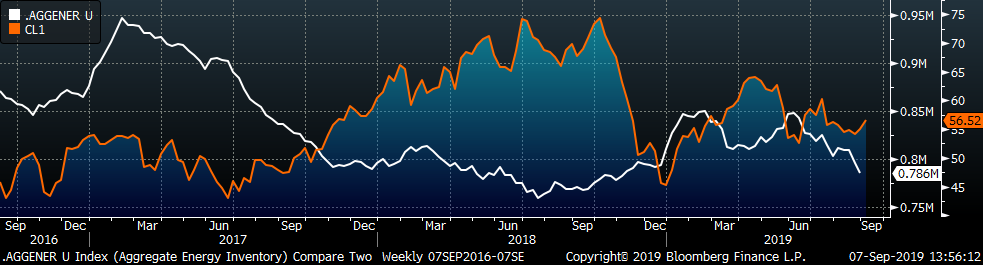
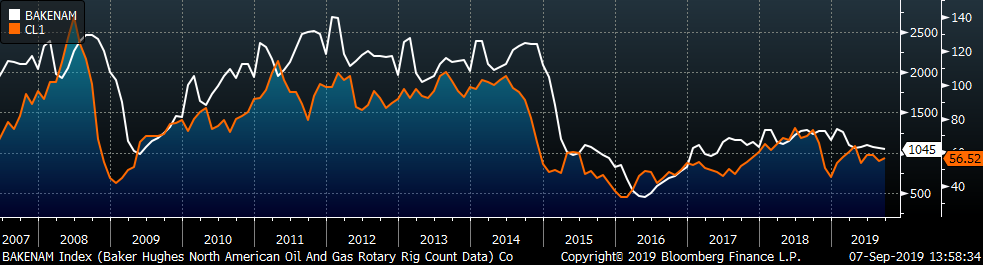
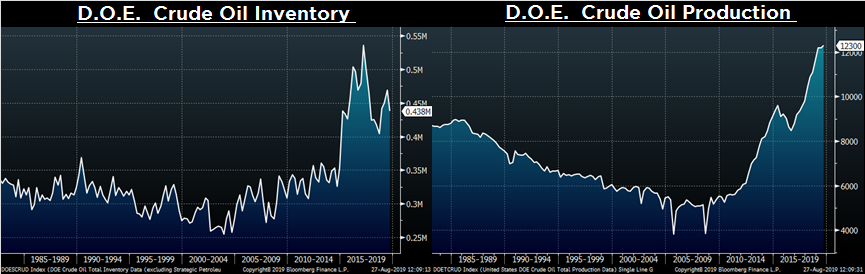
Last week, the October WTI crude oil future gained $1.42 or 2.6% to $56.52/bbl. The aggregate inventory level was 1.2% lower, and crude oil production fell to 12.4m bbl/day. The Baker Hughes North American rig count lost nine rig and the U.S. count lost six.
The list below details some upside and downside risks relevant to the steel industry. The orange ones are occurring or look to be highly likely. The upside risks look to be in control.
Upside Risks:
Downside Risks: