Content
-
Weekly Highlights
- Market Commentary
- Durable Goods
- Upside & Downside Risks


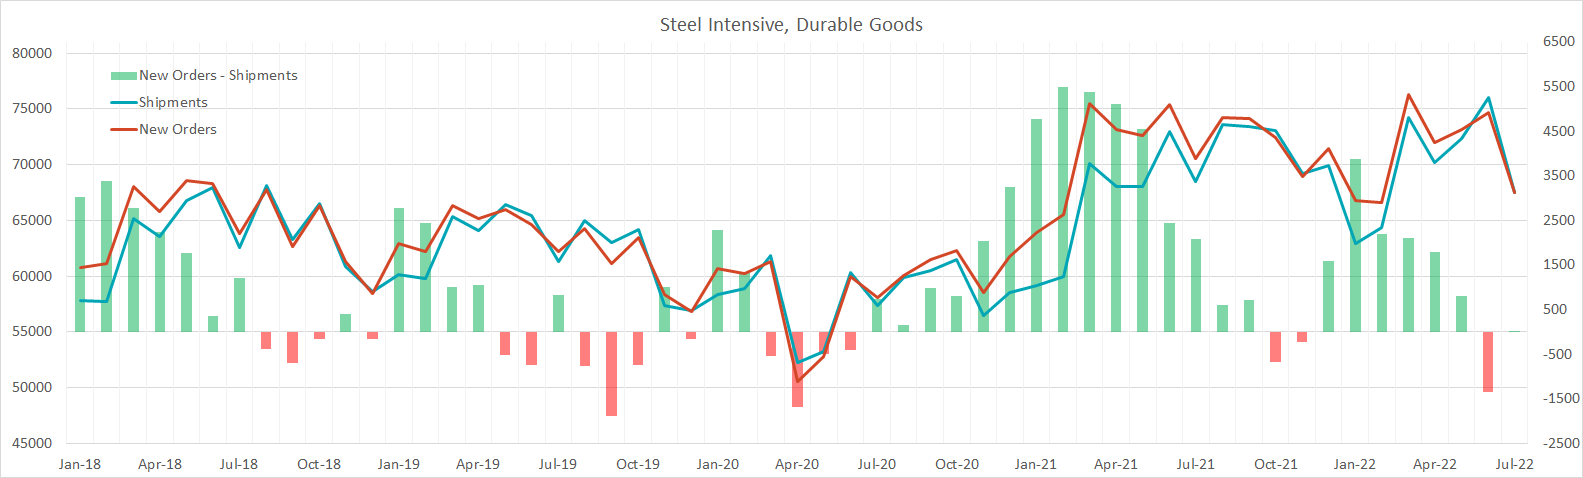
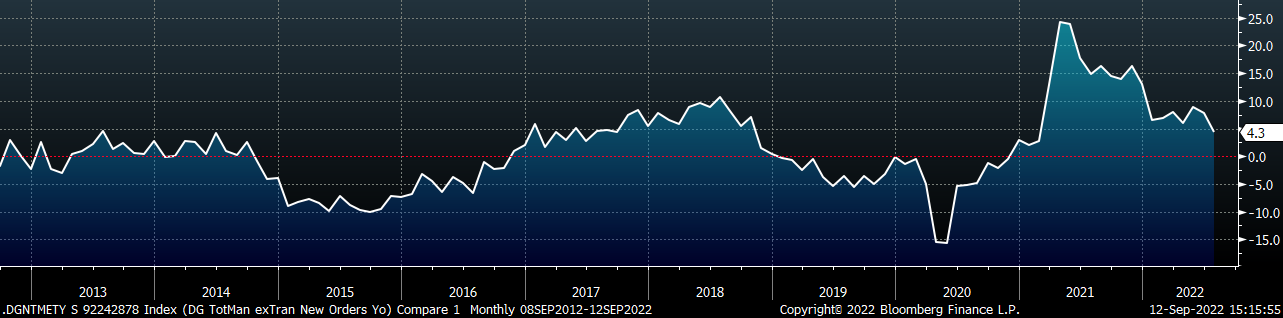
This week, we continue looking at economic data released earlier in the month. The chart below comes from the steel-intensive components of the July durable goods report. The chart below shows shipments in blue, new orders in red, and (new orders minus shipments) with the green/red bars. When the gap between orders and shipments is growing (green), it shows that steel-intensive industries are having a hard time keeping up with current demand. In June, this index went negative for the first time since November 2021 and it was flat in July, with new orders and shipments decreasing to their lowest levels since February.
The table below contains the final data from the July Durable Goods Report, which shows that new orders were mostly higher YoY but considerably below June levels. The main takeaway from the report is that OEM activity slowed compared to last month, but continues to outperform 2021.
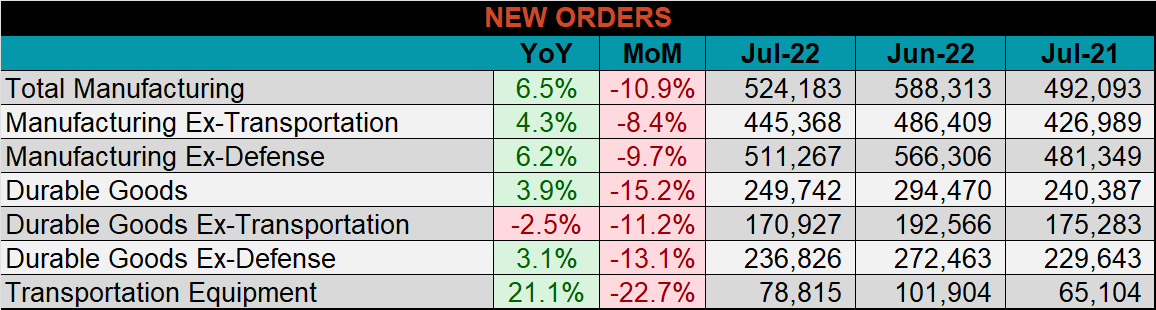
Despite growing at a slowing pace YoY, Total Manufacturing New Orders Ex-Transportation increased for the 20th consecutive month.
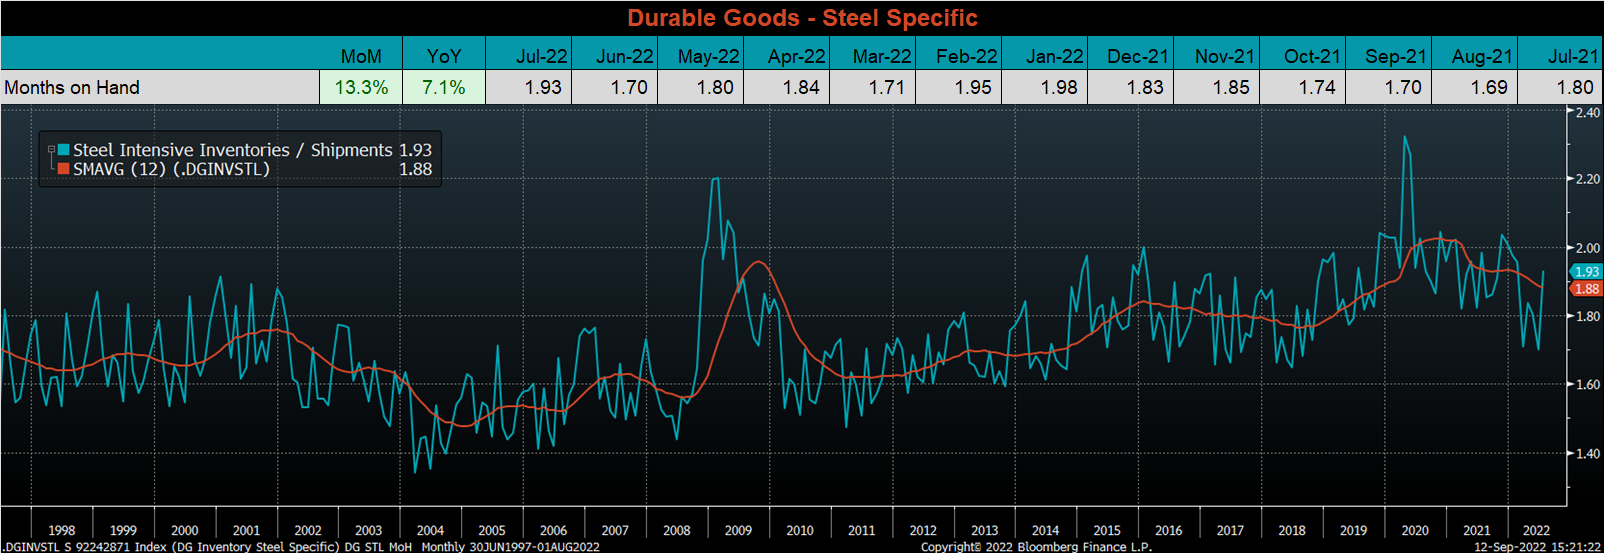
The chart below looks at the months on hand (inventory divided by shipments) from the July durable goods report, using categories that are steel intensive. MoH jumped this month, driven by a 0.8% increase in inventories and an 11.2% decrease in shipments. Typically, July is a down month for shipments, however, this year it was well below normal levels.
Below are the most pertinent upside and downside price risks:
Upside Risks:
Downside Risks:
The Platts TSI Daily Midwest HRC Index was up $20 to $820.
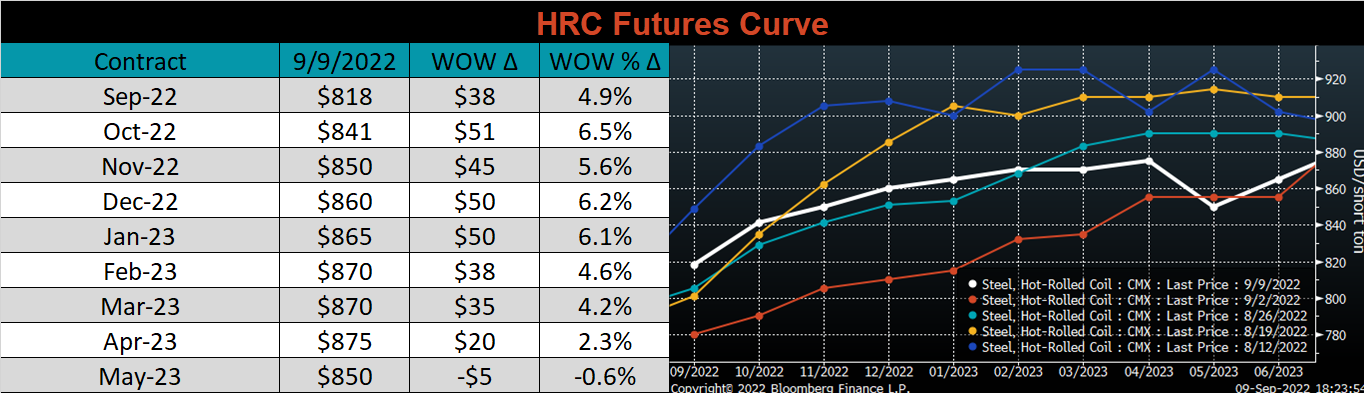
The CME Midwest HRC futures curve is below, with last Friday’s settlements in white. The majority of curve shifted higher, most significantly in the front, which led to an overall flattening of the curve.
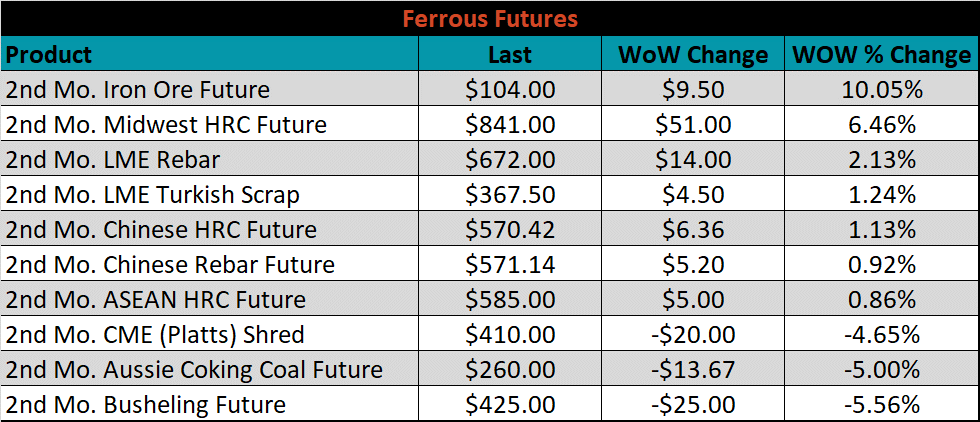
The 2nd month ferrous futures were mixed this week. Iron ore gained 10.1%, while Busheling lost 5.6%.
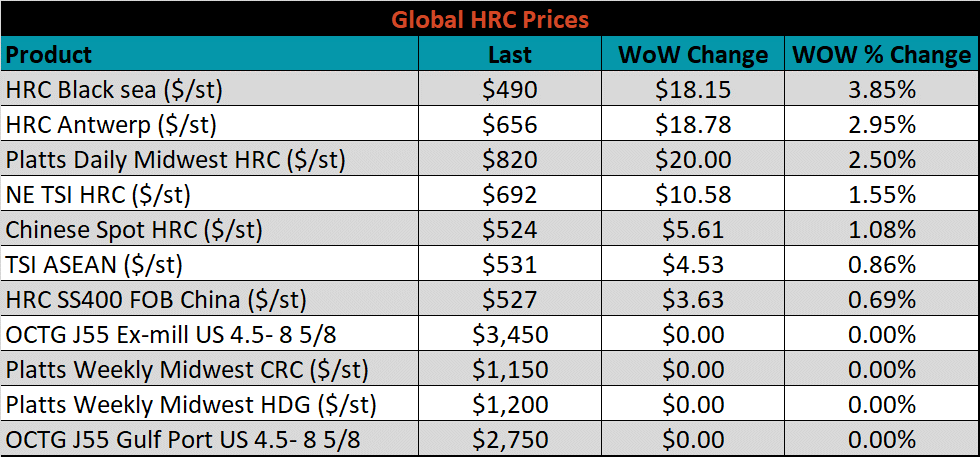
Global flat rolled indexes were all higher last week, led by Black Sea HRC, up 3.85%.
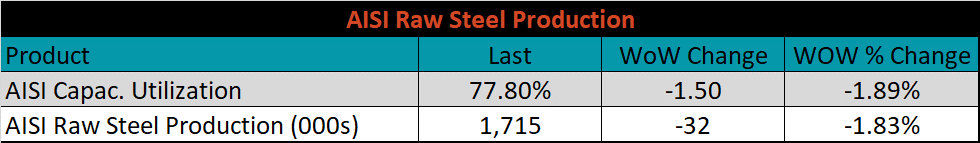
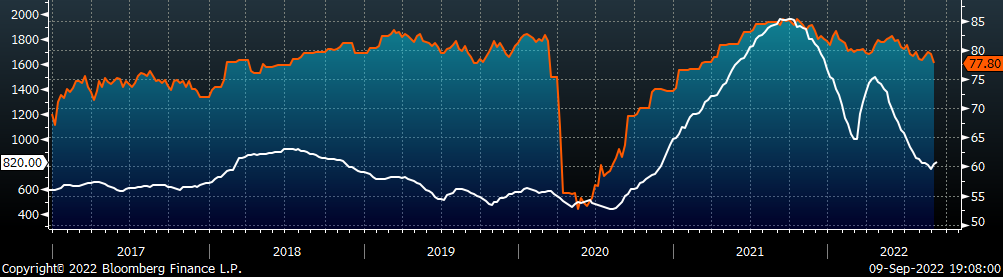
The AISI Capacity Utilization was down sharply, 1.5%, to 77.8%.
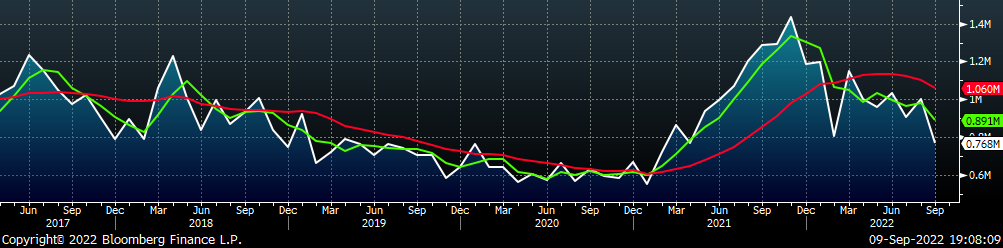
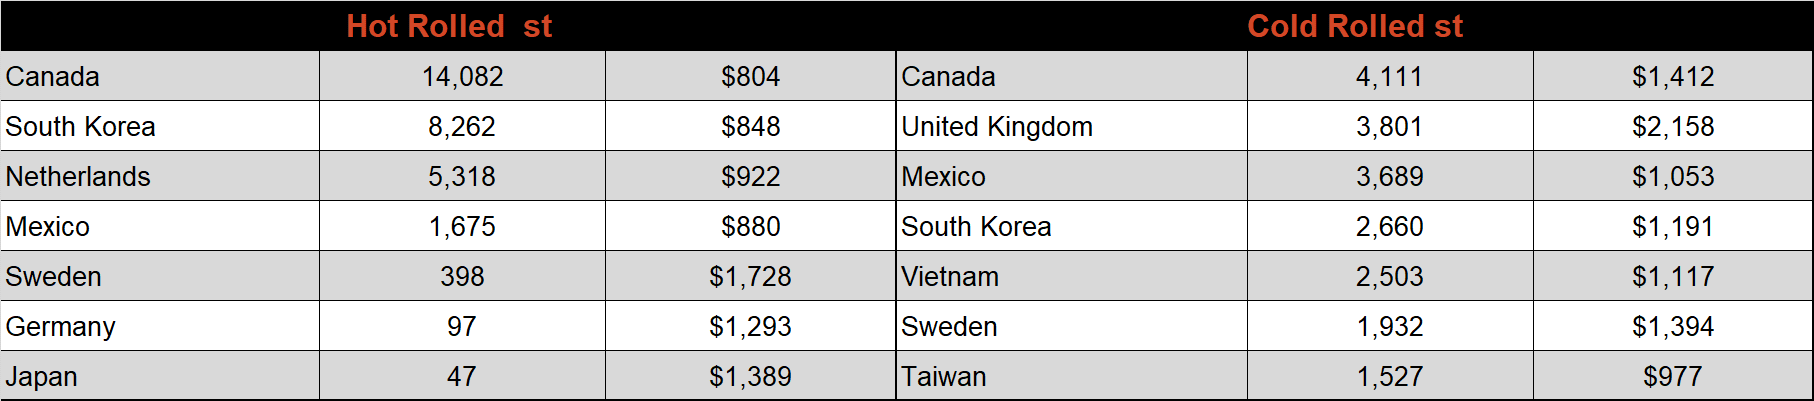
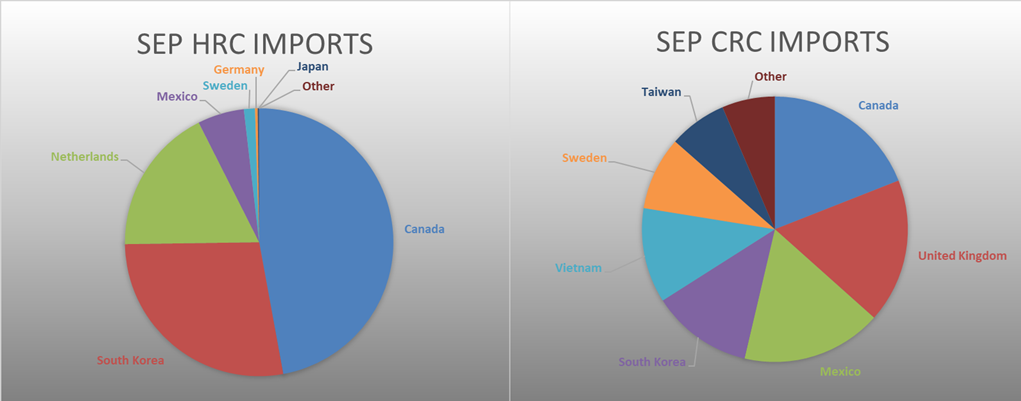
September flat rolled import license data is forecasting a significant decrease of 233k to 768k MoM.
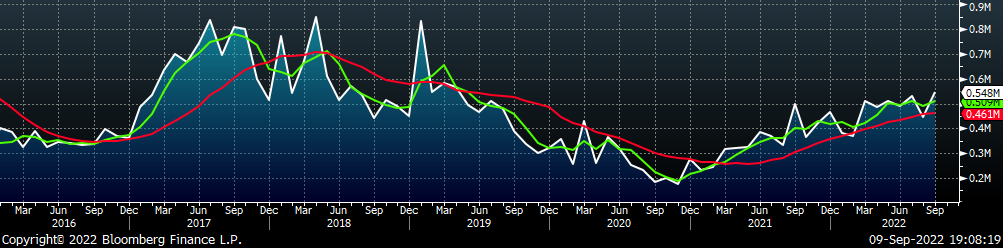
Tube imports license data is forecasting an increase of 101k to 548k in September.
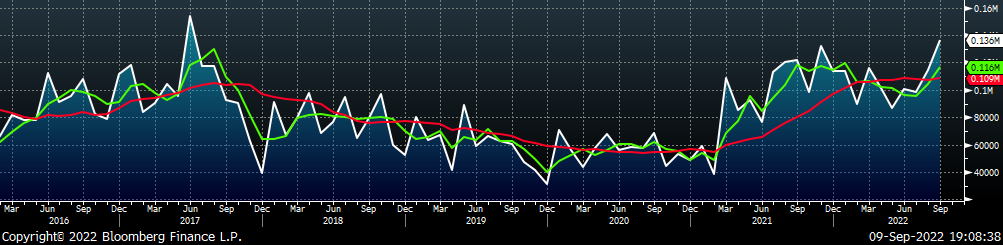
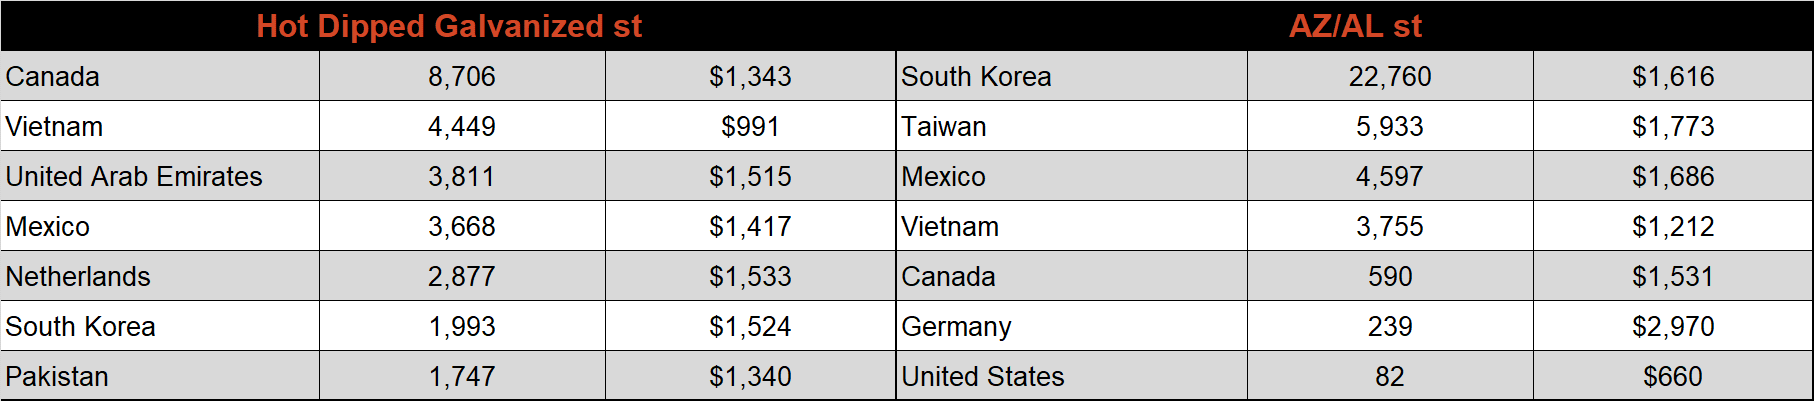
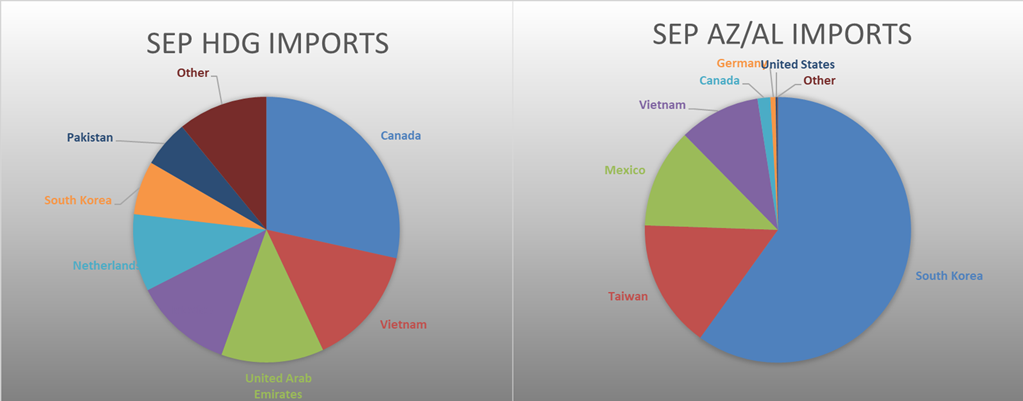
September AZ/AL import license data is forecasting an increase of 22k to 136k.
Below is September import license data through September 6th, 2022.
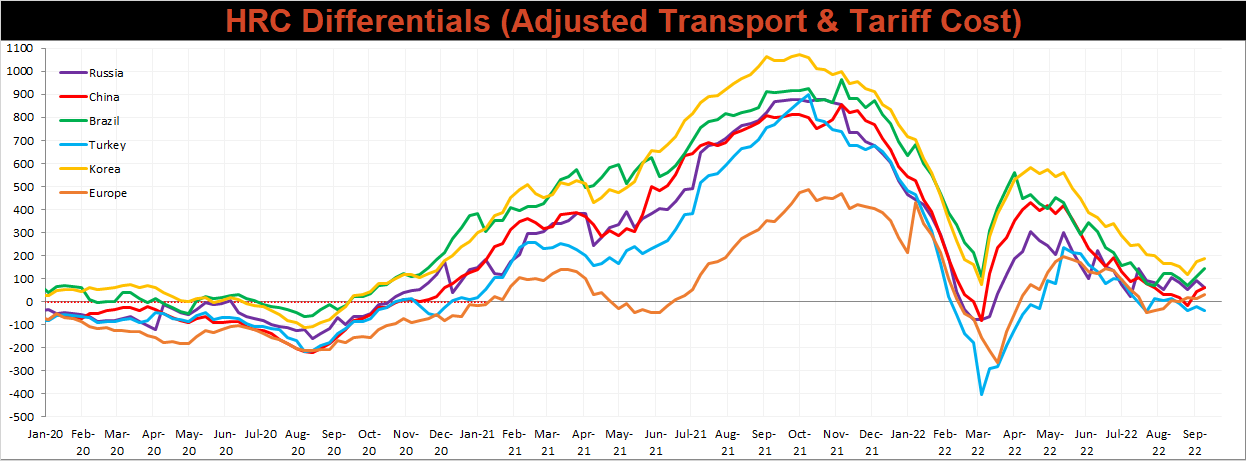
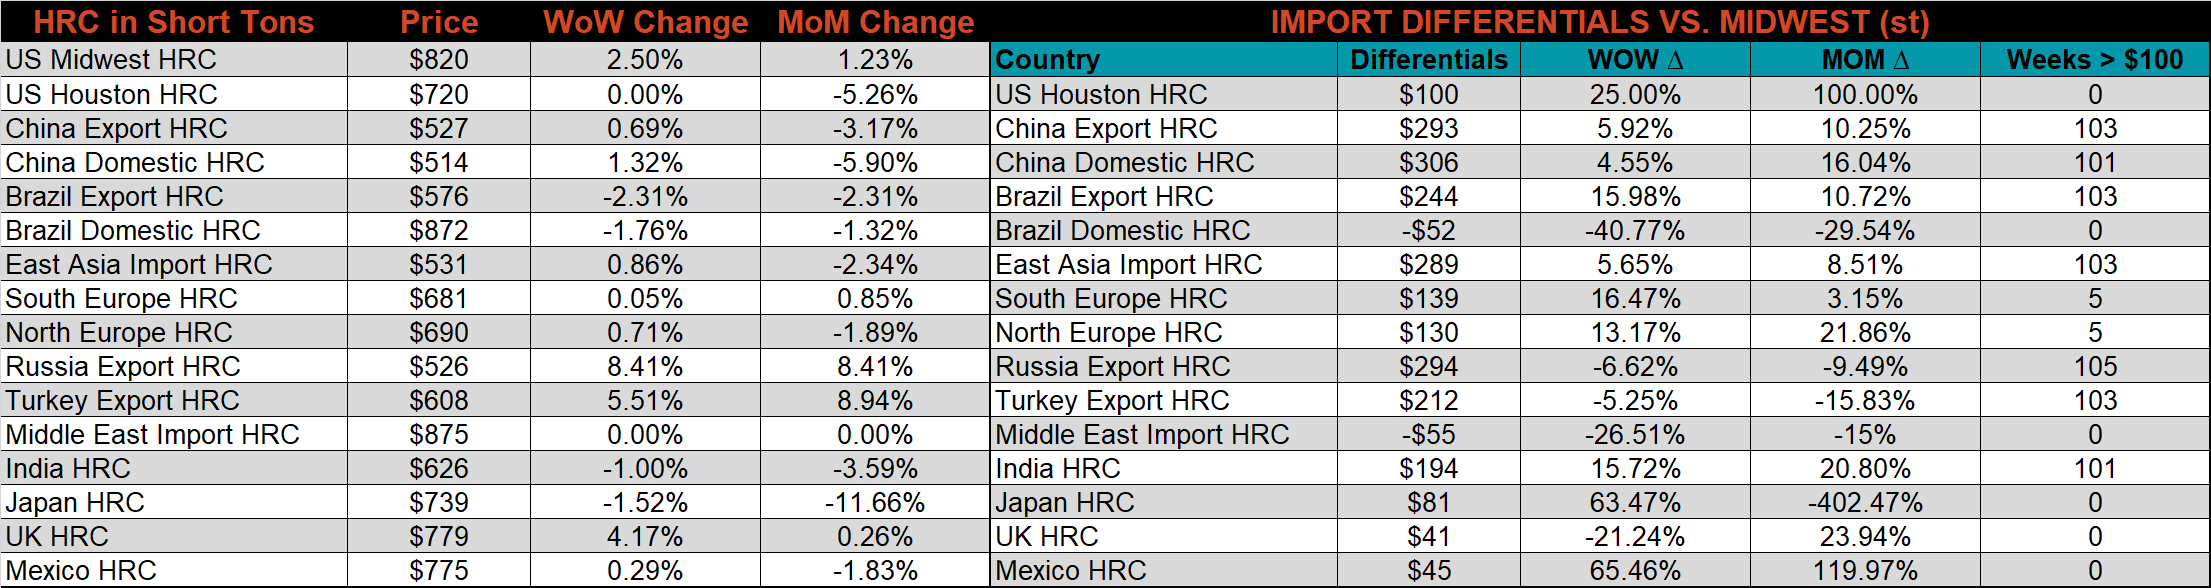
Below is the Midwest HRC price vs. each listed country’s export price using pricing from SBB Platts. We have adjusted each export price to include any tariff or transportation cost to get a comparable delivered price. Differentials increased last week for most of the watched countries, as the U.S. Midwest price continued it’s rise above $800. Russia and Turkey were the two countries that saw a decrease in their differential.
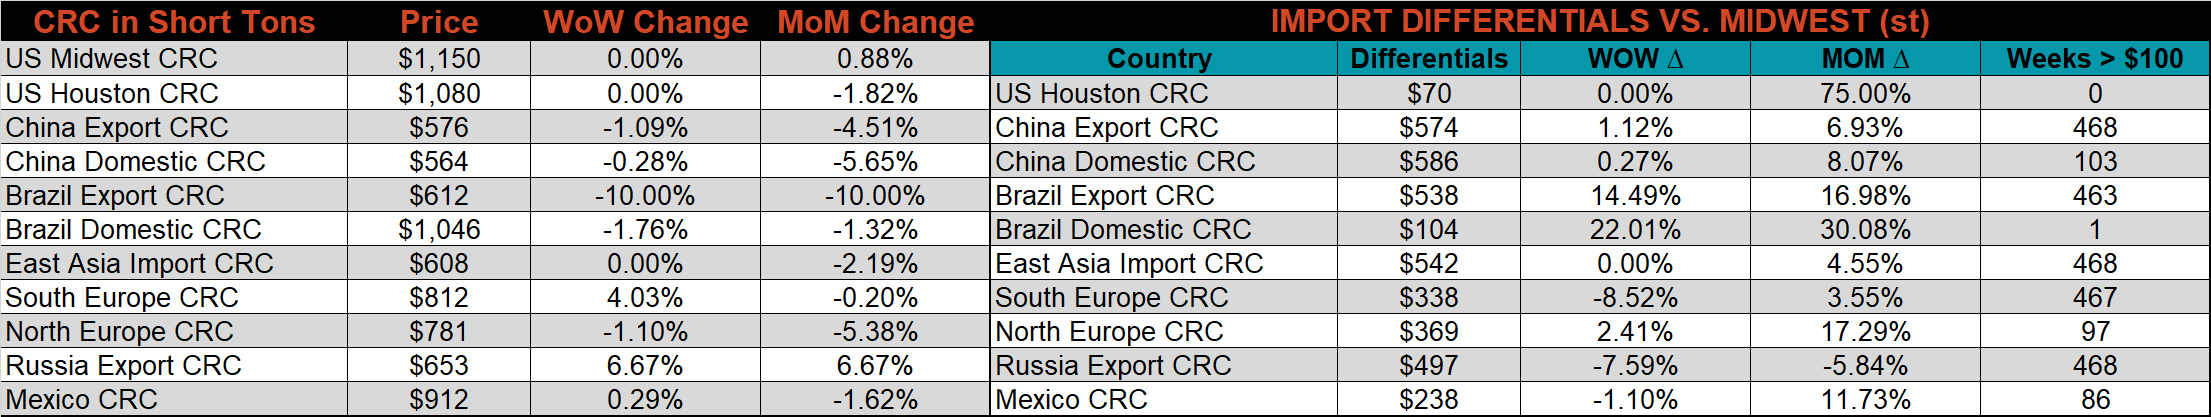
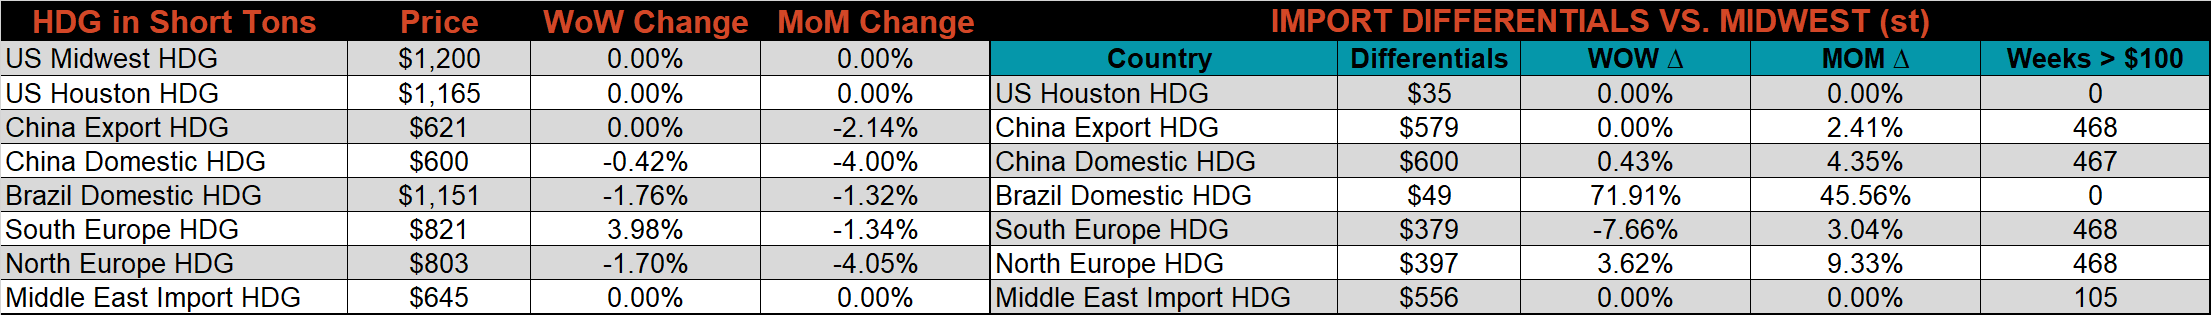
SBB Platt’s HRC, CRC, and HDG pricing is below. The Midwest HRC was up 2.5%, while the CRC & HDG prices were unchanged on the week.
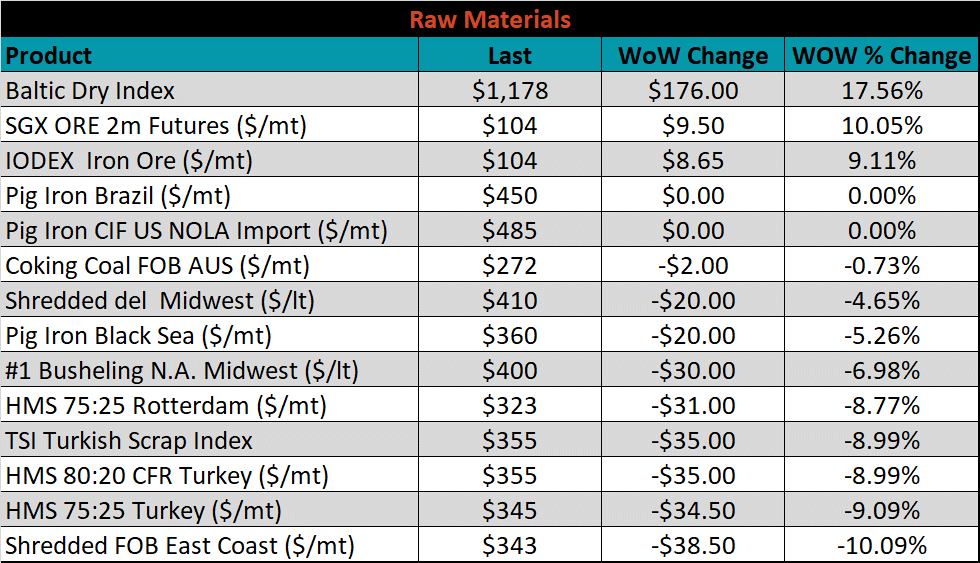
Raw material prices were mostly lower again last week, with East Coast shredded down 10.1%, while the 2nd month iron ore futures gained 10.1%.
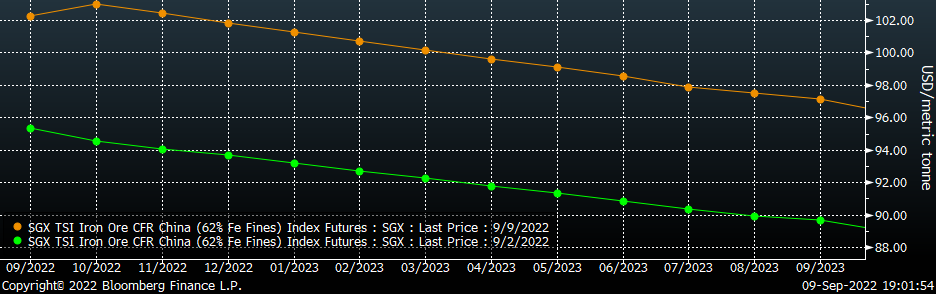
Below is the iron ore future curve with Friday’s settlements in orange, and the prior week’s settlements in green. Last week, the entire curve rebounded sharply higher, this was an anomily as most of the steel raw materials were weak.
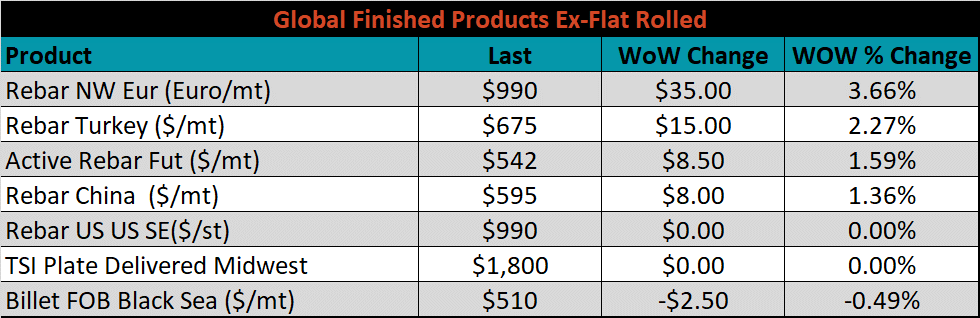
The ex-flat rolled prices are listed below.

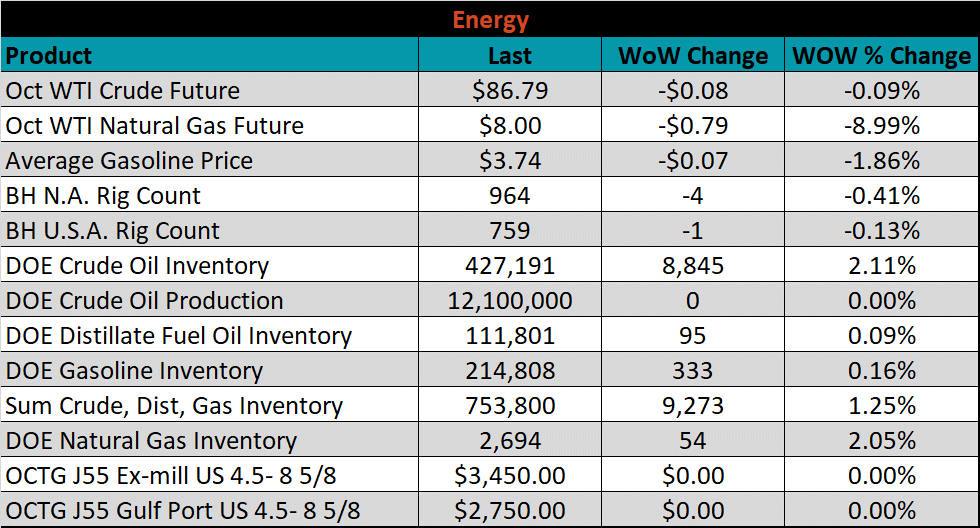
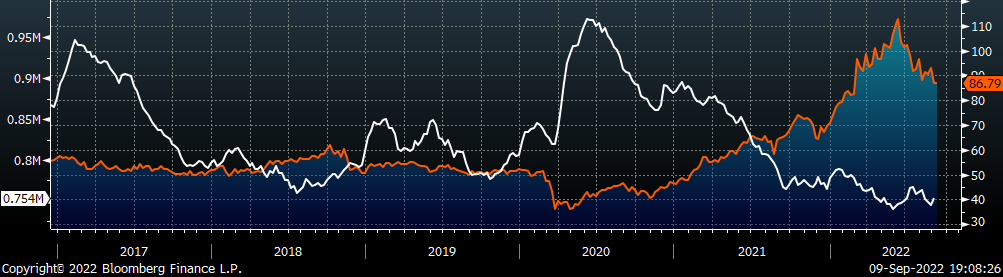
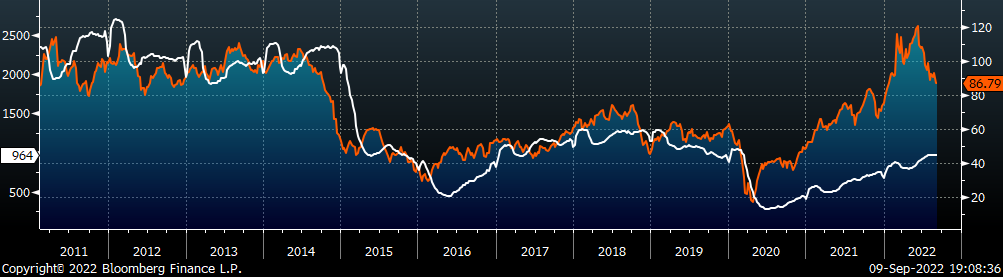
Last week, the October WTI crude oil future lost $0.08 or 0.1% to $86.79/bbl. The aggregate inventory level increased 1.3%. The Baker Hughes North American rig count decreased by 4 rigs, while the U.S. rig count decreased by 1 rig.
The list below details some upside and downside risks relevant to the steel industry. The bolded ones are occurring or highly likely.
Upside Risks:
Downside Risks: